Table of Contents
Bitcoin has been very bullish these past few weeks, breaking through the $12k resistance and currently testing the $13k resistance. We can expect this type of volatility to increase as the U.S election draws closer.
However, in this Bitcoin analysis, we will be analysing two key patterns pointing to a massive bullish move coming in the Bitcoin price. This move as a very high potential of pushing Bitcoin to the $20k region in the coming weeks or months.
Continue reading to find out about these two patterns and how best to take advantage of them.
A Break Of The Converging Triangle.

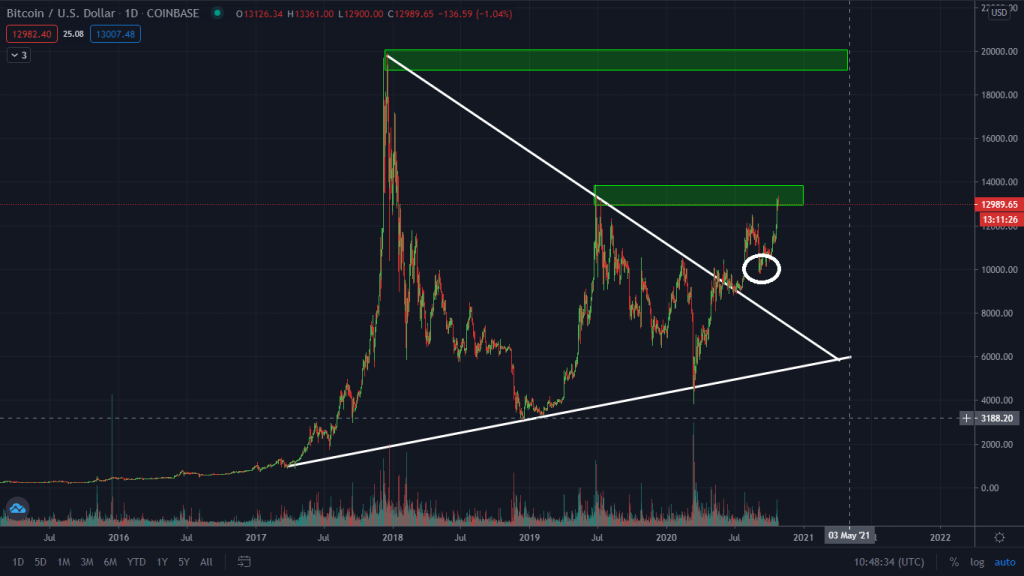
The Bitcoin price recently broke out of a converging triangle pattern, pointing to the end of the prolonged sideways movement we have been experiencing in the market and a start of the new bull cycle.
However, for this bull circle to be confirmed, we must see a clear breakthrough and close above the previous highs which is the $13k resistance level.
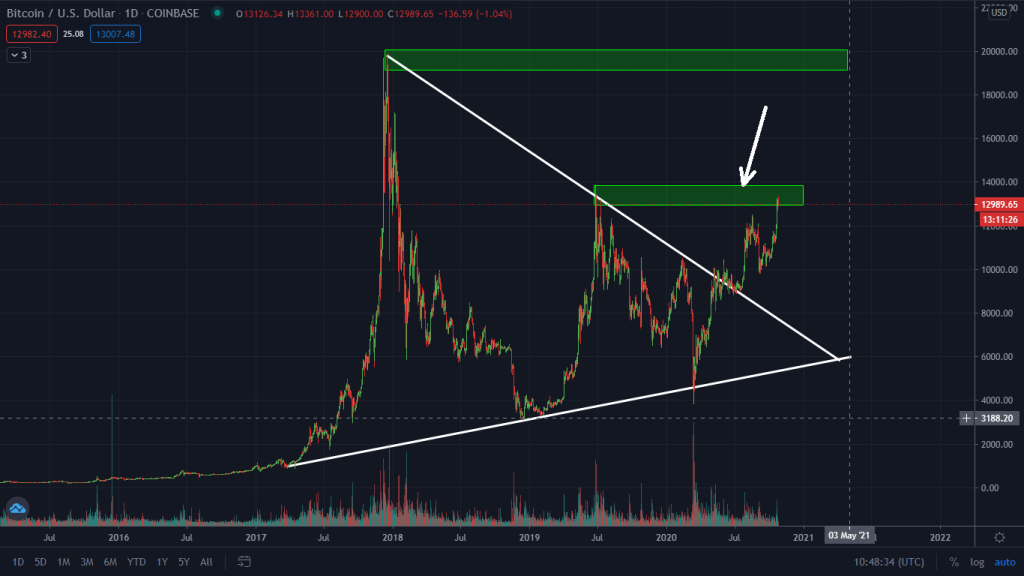
This $13k resistance level is a very key level to keep an eye on, a price failure at this point could see Bitcoin crashing back down in the coming days. But right now, Bitcoin is still looking very bullish as the price continues to surge, forming higher lows.

The most important support to keep an eye on is the previous lows at $10,000. A price break below this support level could see us reversing and crashing lower.
Head and Shoulder Pattern
The second pattern pointing to this coming massive $20k surge in Bitcoin is the Head and Shoulder pattern. This pattern is a high probability trade setup and offers crypto traders an opportunity to partake in this coming bullish run with minimum risk.
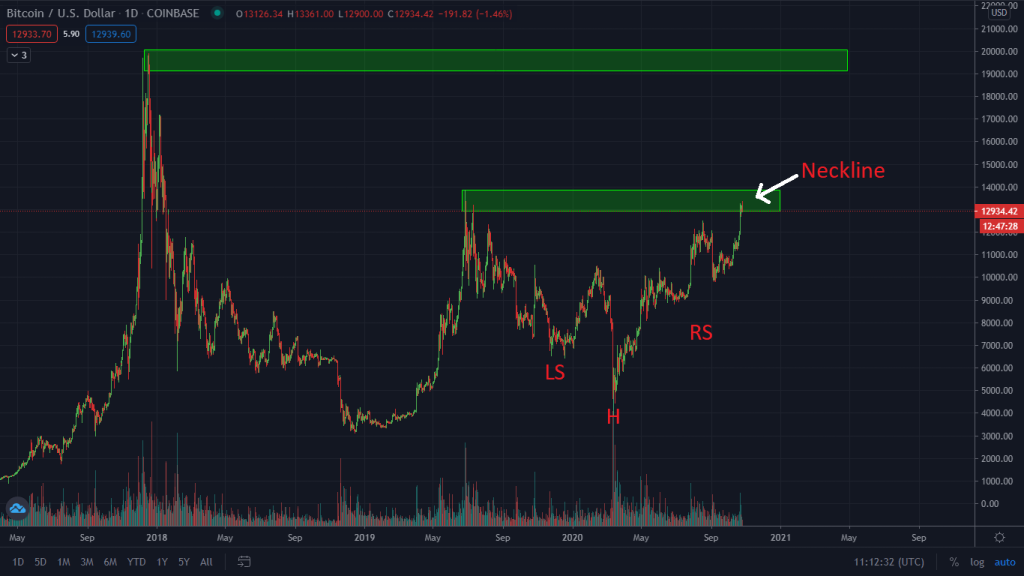
However, at the time of writing this article, the Head and Shoulder pattern developing on the Bitcoin chat is yet to be completed. For the pattern to be confirmed, the price must breakthrough and close above the $13k neckline.
A failure to breakthrough this neckline could see bearish pressure begin to build up on the Bitcoin price.
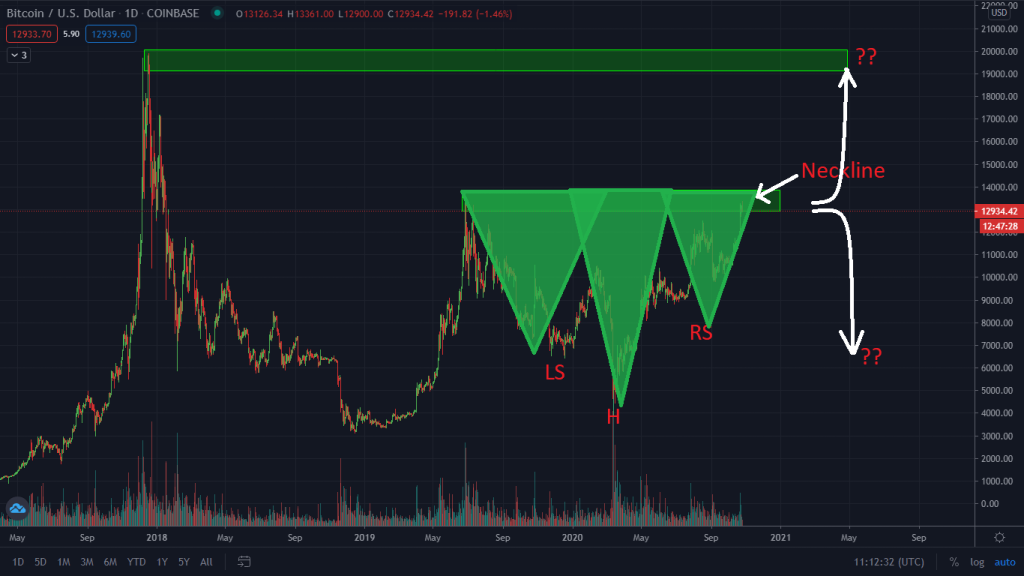
It is also important to keep an eye on the volume indicator. A breakout should be confirmed by a spike in the bullish volume of Bitcoin. This spike in the bullish volume indicates there is an increased buying of the cryptocurrency.
We also created a video here: ‘link‘ where we analysed these two patterns and also pointed out a few key fundamentals driving the Bitcoin price higher.
To gain more information on how to partake in this coming Bitcoin Bull run and trade this cryptocurrency, you can read my How To Trade Bitcoin Guide. You can also check my top list of Best Bitcoin Exchanges To Trade With


