Table of Contents
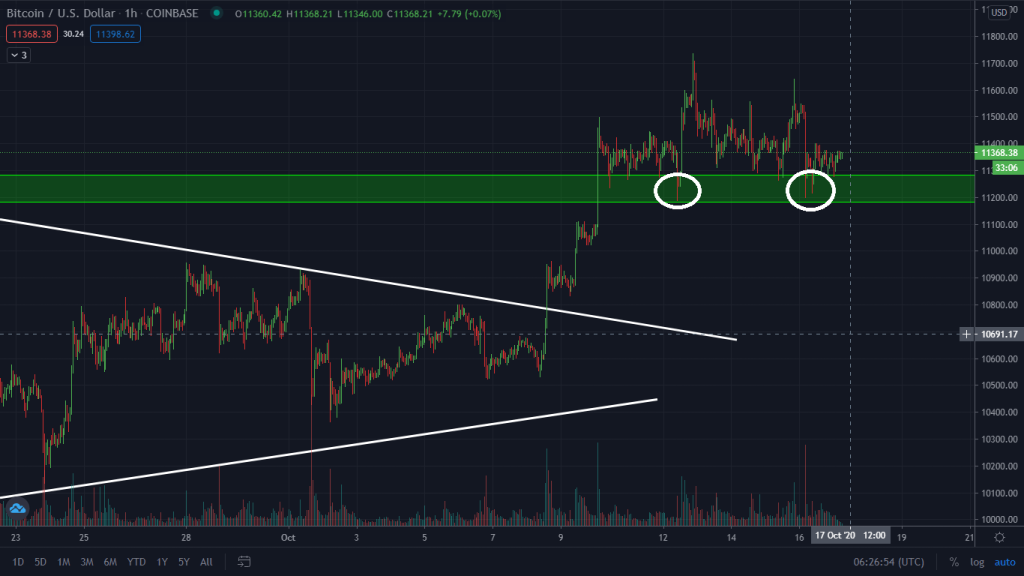
The Bitcoin price has been consolidating and trading sideways for a few weeks now after it found support at the $11,181 price region. This region is very important to the bulls because a bounce or break of this critical support could strongly influence the short term trend of the Bitcoin market.

With that being said, it is important to note that the Bitcoin price is currently forming a bearish head and shoulder pattern, and there is a very high likelihood that we might see a price crash back down to the $10,000 region in the coming days.
Trading The Head and Shoulder Pattern.

The Head and Shoulder pattern is still yet to be completed as Bitcoin continues to range sideways above the neckline of the pattern.
However, a break below that neckline (which also coincides with the $11,181 critical support price level), could signify that the bearish pattern is completed and we can begin looking for shorting opportunities to the downside.

It is also important to keep an eye on the volume indicator. This indicator can help us paint a clear picture of the general bullish or bearish bias Bitcoin traders are having at any point in time.
A break of the Head and Shoulder pattern neckline with a significant surge in volume can be translated as a clear indication that Bitcoin traders are short term bearish on Bitcoin, and we can expect to see price follow through and continue to crash lower once that $11,181 support gives way.
Price Targets

The Head and Shoulder pattern has a standard way of calculating the price targets to aim for. That calculation puts the price target at the $10,900/$10,800 regions.
This $10,800 price region also served as a strong support and resistance region in the past, and there is a high likelihood for Bitcoin to crash to this region and then find support and bounce from there in the coming days.

To gain more information on how to partake in this coming Bitcoin Bull run and trade this cryptocurrency, you can read our How To Trade Bitcoin Guide.
You can also follow our Youtube Channel, where we upload daily Bitcoin price analysis. If you are still new and searching for the best brokers to trade with, you can check our list of Best Bitcoin Exchanges To Trade With


