
VIRTUAL breaks above $1.83 and EMA 20/50 – is it the beginning of a recovery or just a short-term impulse and the end of the local rally? We observed a local low at $1.61, followed by a sharp rebound to $1.83 and even a breakout above EMA 20/50. With positive EMAs and RSI confidently approaching the overbought zone, what could all this indicate?
VIRTUAL Overall Price Structure
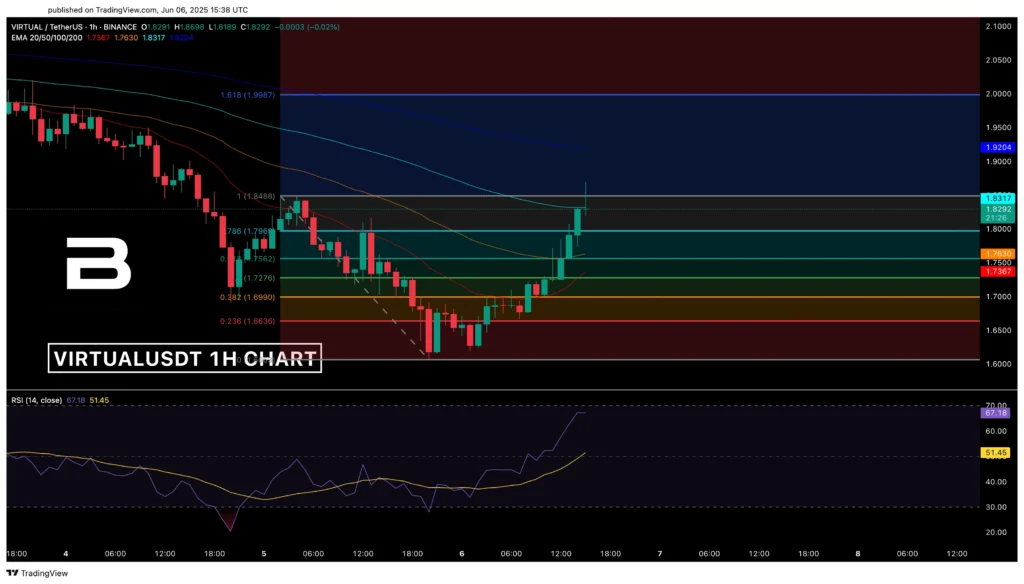
First of all, VIRTUAL is still under pressure from a broader downtrend, and the sharp rebound from the local low at $1.605, despite its speed, is testing that. However, we are seeing clearly positive angles on EMA 20 and EMA 50 and a moderately positive EMA 100. Still, such a rapid rebound against the backdrop of a recent downtrend has pushed RSI to near-overbought levels at 67.18.
VIRTUAL EMA and RSI
- EMA-20 ($1.738). This level was crossed quite sharply, and we even held above it, and the clearly positive angle confirmed the presence of strong momentum.
- EMA-50 ($1.763). This level was also broken sharply, without any resistance or consolidation, and we even held above it, although its angle was not as strong as the previous one. This may indicate that momentum remains in effect on the mid-term cycle.
- EMA-100 ($1.832). This one is more difficult, as we are currently observing a battle between buyers and sellers around this level, and holding above it or pulling back could be decisive for whether momentum continues or fades.
- EMA-200 ($1.920). We have not yet reached this level, but it would become the target in case of a confirmed breakout above EMA 100, which would then act as support for a confirmed trend reversal.
RSI
RSI currently stands at 67.18 and has been steadily rising throughout the recovery phase, starting from the 30 mark. Right now, we are close to the overbought zone, and a key signal could be how RSI behaves in the 68–72 range. If it holds above 70 for several candles, a breakout of $1.85 and a test of the 1.618 extension may follow.
VIRTUAL Fibonacci Key Zones
- 0.236 ($1.663) the initial resistance level at the beginning of the upward phase, which was broken on increasing momentum without pause, indicating buyer pressure
- 0.382 ($1.699) here we observed a short-term pause and recorded a slight pullback but formed a base level of impulse support
- 0.5 ($1.727) this is a more significant point not only because we confirmed momentum but also broke through EMA 20 ($1.763), so the breakout and hold above it confirmed a short-term bullish structure and created a basis for support
- 0.618 ($1.756) an even more important level, clearly confirming the reversal on which we held, with RSI crossing above 60
- 0.786 ($1.796) here the confirmed structure shift without resistance or consolidation and was supported mid-term by a breakout above EMA 50
- 1.000 ($1.848) here we observed more tension between sellers and buyers, as reflected by the candle wick, but buyers ultimately gained control and tested EMA 100; we can now speak of signs of an upward trend recovery, but only if we hold above EMA 100
- 1.618 ($1.998) if we hold above, this entire zone becomes a potential continuation area for the uptrend unless the move to this level pushes RSI into extreme territory
Market Sentiment and Scenarios
Thus, we are likely observing an attempt at aggressive recovery and a shift in control to buyers. However, the high rate of growth with RSI > 67 requires caution, and a short-term profit-taking event cannot be ruled out, for example, around $1.85.
📈 Potential Bullish Scenario
- Holding above $1.848 (previous high) with RSI > 70 and the formation of a candle with a strong body
- Target. a rise to $1.998 (1.618 Fibo extension), especially if volume buying continues
- Invalidation. drop back below $1.796 and a close under EMA-100 with RSI < 60
📉 Potential Bearish Scenario
- Formation of a pullback candle with a body below $1.796 and RSI < 60
- Target. a decline to $1.727 (0.618), followed by possible consolidation in the $1.699–$1.727 range
- Invalidation. renewed rise above $1.848 and RSI breakout above 70 with candlestick confirmation
✅ Potential Entry. On a retest of the $1.796–$1.805 zone with RSI > 60 and candle confirmation such as a long-tailed candle with high volume
🛑 Potential Stop. Below $1.756 (0.705) and EMA-50 with RSI < 55 and a volume-backed breakdown candle; a re-entry may be considered after a reversal pattern forms above EMA-100
Ready to trade? Join WEEX via Bitcoinsensus and get a 20% deposit bonus — with up to 400 USDT waiting for you. Claim your share of the 30,000 USDT reward pool.
Conclusion
Overall, VIRTUAL is in a potential phase of breaking out of the downward structure, and the current impulse may be the strongest signal of recovery and the start of an uptrend.
However, the next 1–2 candles near the $1.848 level and RSI 70 require close attention and may determine whether the move enters an expansion phase or a correction follows.


