UNI rebounds twice from $6.212 but fails to break through $6.450, which aligns with EMA 50/100/200 and the 0.382 Fibonacci level. No clear breakout has followed, and with RSI slightly above 40, there are no confirmed signs of a trend reversal yet. Are we witnessing a consolidation phase before a move higher or just a weak rebound within an ongoing bearish structure?
UNI Price Structure Overview
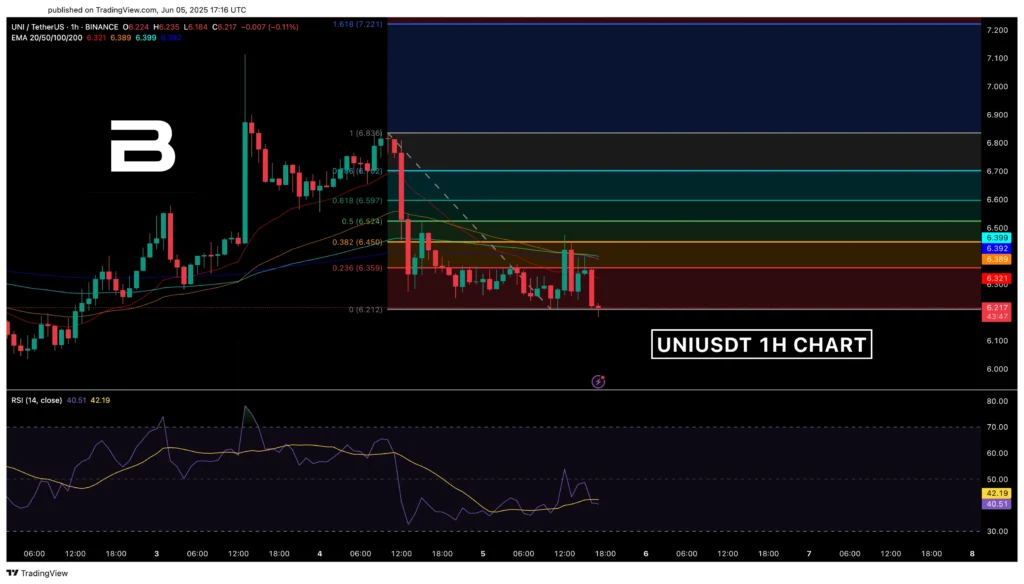
So far, $6.212 has been held as confirmed support. The price hasn’t moved below it and continues to trade within this tight range. However, the rebound has not yet evolved into a bullish trend — each attempt to rise has been capped below $6.359 (Fibo 0.236), and the broader structure remains under downward pressure.
UNI EMA and RSI
- EMA-20 ($6.322) Currently positioned below the 0.236 level, acting as a dynamic resistance. Its downward slope does not yet indicate a short-term reversal.
- EMA-50 ($6.390) If we see a decisive break above EMA-20 and a sustained close above EMA-50, that could signal a shift in phase control. The slope here is less negative, suggesting some potential for recovery in a broader timeframe.
- EMA-100 ($6.399) and EMA-200 ($6.392) These levels nearly coincide with EMA-50, but EMA-200 has an upward slope. Together, they form a dense resistance cluster, and breaking through would likely require a strong volume-based move, potentially triggering a short squeeze.
RSI
For the first time in a while, RSI has moved out of the 38–39 zone and is now gradually turning up. This is not yet a confirmed trend reversal, but it may be an early signal of waning selling pressure.
UNI Fibonacci Key Zones
- 0.236 ($6.359) Currently the primary resistance area where price action repeatedly stalls. A breakout and close above this level would be the first sign of a possible shift in structure.
- 0.382 ($6.450) The next resistance zone and also the convergence point for the major EMAs. A test here becomes more likely if the price breaks and holds above 0.236.
- 0.5 ($6.524) A breakout beyond this point would suggest the end of a deep correction and the possible start of a new trend cycle.
- 0.618 ($6.597) If the price reaches this level, it could indicate full recovery of the previous downtrend or the beginning of a new cycle. This would likely require RSI to move above 60.
Market Sentiment
At this stage, the market still reflects the dominance of the prior bearish impulse. However, after more than 36 candles of sideways action in the $6.212–$6.359 range, signs of stabilization are starting to emerge.
The double test of $6.212 with a clear buyer response, consolidation near the lower bound, and an upward tilt in RSI forms a modest but potentially constructive base for recovery. However, the density of EMA resistance and uncertain volume conditions still warrant caution.
📈 Bullish Scenario
- Break and close above $6.359 (Fibo 0.236) with the candle body above EMA-20. RSI should push above 45 and hold there for at least two candles.
- Target. Move toward $6.450 (0.382), with a potential extension to $6.524 (0.5).
- Invalidation. A return to $6.212 with a candle close below this level, accompanied by RSI falling below 40.
📉 Bearish Scenario
- Loss of the $6.212 support with RSI dropping below 38, accompanied by a candle body that breaks support without a buying tail.
- Target. Downside toward $6.150, and potentially to $6.05 if bearish momentum continues.
- Invalidation. Break and close above $6.359 with an RSI > 45 and a strong bullish candle structure.
✅ Potential Entry. On a bounce from $6.212 with RSI > 41 and bullish candle confirmation. Alternatively, on a breakout above $6.359 with an RSI > 45 and strong momentum.
🛑 Potential Stop. Below $6.212 if RSI < 38 and a bearish breakout candle forms or re-entry is possible only after RSI recovers above 40 with a reversal pattern in place.
Conclusion
UNI is showing early signs of a slow and tentative recovery after consolidating near its $6.212 low. However, without a clean breakout above $6.359, the market remains within the confines of bearish pressure.
The reaction around this level and confirmation via RSI will determine whether UNI transitions into a recovery phase or sees renewed downside pressure.


