
Table of Contents
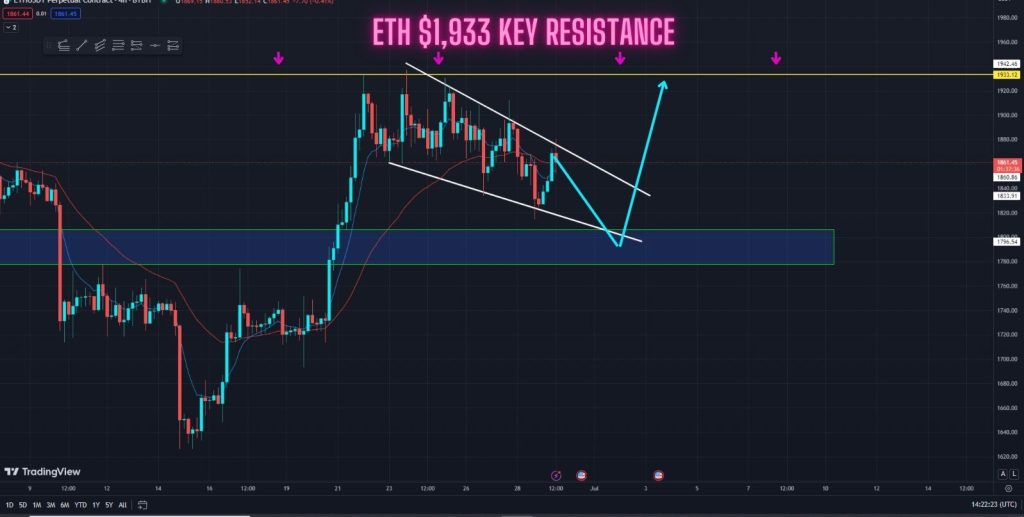
In our previous Ethereum analysis Watch This ETH Bullish Target For This Key Pattern! we identified the key Converging Triangle Pattern forming in the 4-hour timeframe and warned our readers of a potential price rally in the coming days.
Well, that bullish prediction is playing out exactly, and in this ETH analysis, we will be updating you on what the ETH price is doing right now and what is possible in the coming days.
To trade ETH with leverage, sign-up to Bybit right now! Bybit’s BIGGEST Bonus Campaign is now live! You can get up to a $30,000 Bonus when you fund your Bybit account with our Bybit link
ETH $1,933 Bullish Target Smashed! What Now?
The Ethereum price has smashed through our $1,933 bullish target in the 4-hour timeframe and the price is still currently pushing up higher! This shows that the bulls are still in control of this market for now.
However, the question most traders are asking is “How long will this current rally last and what should we expect next?”
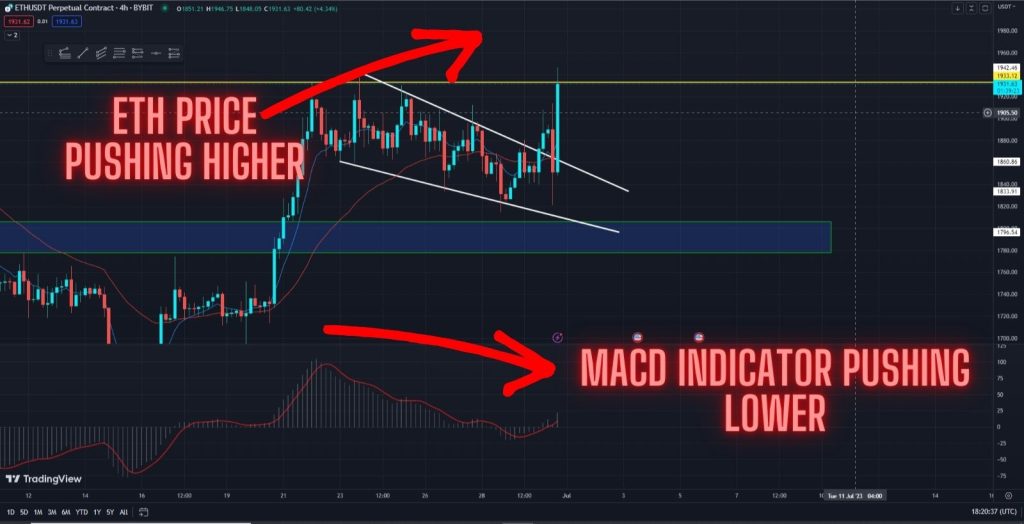
Well in this ETH analysis, we will be identifying the Bearish Divergence that is right now developing in the 4-hour timeframe. This bearish divergence is a clear warning to our readers to be cautious as this might be a sign that ETH does not have a long way to go to the upside.
What Does A Bearish Divergence Mean?

The image above is what a completed bearish divergence should look like!
Bearish Divergence shows weakness in price. The bearish divergence is caused when the price is moving higher while the MACD indicator keeps on moving lower. Once this happens, it signifies that the asset might be weak and ready to sell off.
Right now, the Ethereum price is rallying higher, but the MACD indicator is showing a clear sign of a downtrend.
This tells us that “while the price might be moving up, bullish volume is dying down” and if this continues, sooner or later the ETH price will reverse.
Final Verdict!
The ETH price has broken out of the 4-hour timeframe converging Triangle pattern and is pushing higher! So for now we remain bullish on the Altcoin price.
However, we are beginning to see signs of weakness creep into the price chart as Ethereum is diverging from the MACD indicator. This is a sign of growing weakness in the bullish rally and we will stay cautious as we continue to watch the ETH price action develop.
How to Trade Bitcoin (BTC)?
To understand the basics of Bitcoin trading, you can read our How To Trade Bitcoin Guide. It can prove helpful for traders who are just getting started with Bitcoin trading. You can also check out our list of top Bitcoin Exchanges To Trade With.

PrimeXBT Covesting: Trade Hassel Free
Sign-up on PrimeXBT today to trade Bitcoin hassle-free. You can copy experienced traders and access hundreds of different strategies on the platform! Don’t forget to claim your 25% bonus by using the promo code “bitcoinsensus50” when you sign-up with our link PrimeXBT Covesting


