Table of Contents
Bitcoin is currently bearish and trading in a downtrend, and if you follow my daily Bitcoin analysis, then you should have been sufficiently informed before this bearish move started.
Well in today’s Bitcoin analysis, I will be talking about the current chart pattern bitcoin is trading in and analyzing a bullish trade setup that is currently forming on the one-hour timeframe.
The Falling Wedge Pattern And How To Trade It

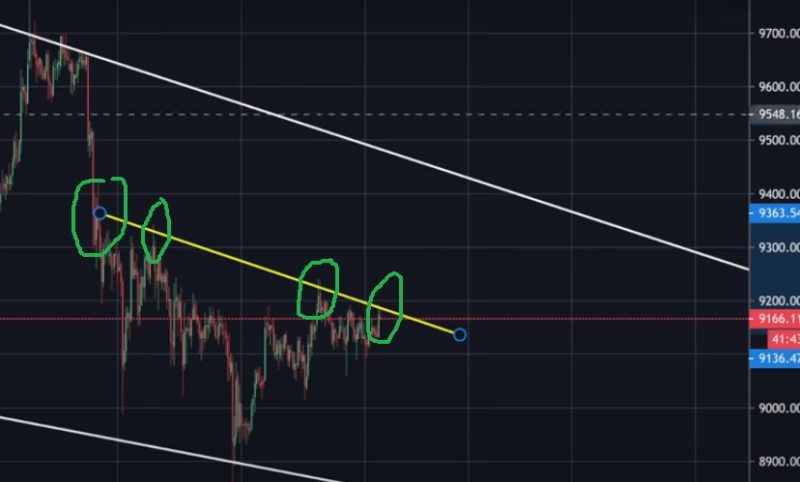
Bitcoin is currently trading in a falling wedge pattern. This pattern is so important because it provides us, day traders, numerous opportunities to trade and make money from the market.
I expect the price to continue bouncing off of the channel’s support and resistance line even as it continues heading lower in the coming days.

Following this simple price prediction, we can clearly see that the Bitcoin price has just bounced off of the base channel of the falling wedge pattern and as started pushing back up.
This provides me a high probability trade setup especially when you combine it with the bullish inverse head and shoulder chart pattern I will be talking about in detail below.
The Inverse Head and Shoulder Pattern. A High Probability Trade Setup
Going lower to the one-hour timeframe, I can clearly see a very bullish inverse head and shoulder pattern forming.
I can trade this coming bullish price breakout with this pattern for added precision and quality.

The bullish pattern is nearly completed, the only thing I am currently waiting for is my confirmation signal, and that is the price break and close above the neckline.
The price break above the neckline is so important because this neckline as severed as multiple price resistance in the past.
If the price is unable to break through and close above it, we might see the pattern fail and the bears return to push the Bitcoin price even lower.
Target Levels To Aim For
The profit target level is gotten by measuring the distance between the head of the pattern “H” and the support baseline.
This distance is then projected upward to get the target for where the Bitcoin price might rise to once the market begins to move.

The target level that was gotten for this move is $9,620. So, we can expect the price of Bitcoin to rise to around this region in the coming days.
However, it is important to point out the major resistance the price might encounter from the fallen wedge top channel.
This resistance might make it a little bit difficult for the price to actually reach my target of $9,620.
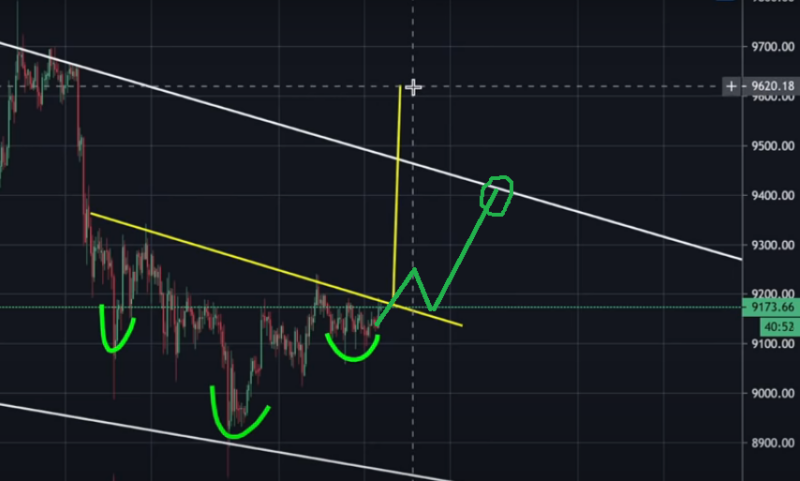
So, instead of aiming for the head and shoulder target as my take profit region, I will instead aim for the top of the falling wedge channel which is around $9,300 to $9,400 price region.
To gain more information on how to partake in this coming Bitcoin Bear run and trade this cryptocurrency, you can read my best time to trade bitcoin Guide and follow my daily bitcoin analysis. You can also check my list of top 10 crypto exchanges.


