
FET down 20.8% – is $0.645 support strong enough to spark a rebound, or will a new low confirm a trend shift? RSI is at 29.20, the EMA structure is sharply bearish, and multiple resistance levels lie ahead, starting with the 0.236 Fibo at $0.686 and the EMA-20 at $0.678. Are there any potential signs of recovery, or is caution still warranted? Let’s take a closer look.
FET Overall Price Structure
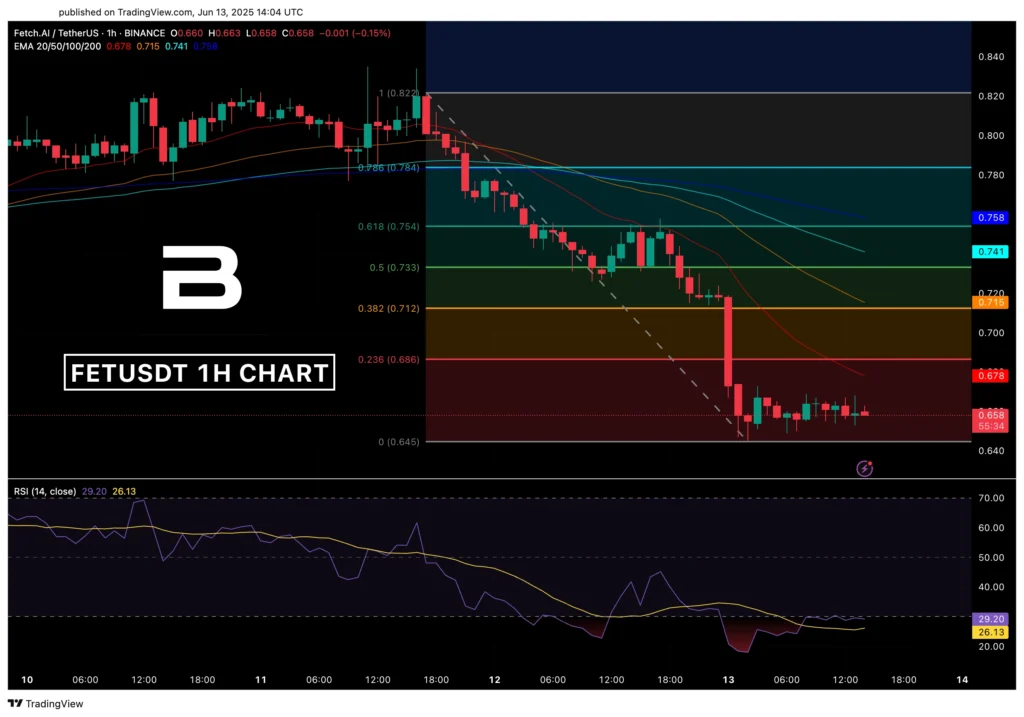
FET is showing a pronounced decline, having lost over 20% from the local peak of $0.822 and reaching a low of $0.645. All EMAs are clearly trending downward and remain above the price, including the EMA-20, and for FET to recover, it will need to break through multiple resistance levels. The movement has now entered a consolidation phase, with recent candles remaining low in volatility and close to the latest support level. Nevertheless, EMA angles are softening, and RSI remains in the oversold zone.
Want more than just trading fees back? BloFin’s new promotion lets users unlock tech gadgets and luxury prizes — up to a Rolex — based on trading volume. Plus, get 20% cashback up to $500 just for depositing.
FET EMA and RSI
- EMA-20 ($0.678) remains the short-term resistance level, maintaining a strong negative slope, although the angle has clearly started to soften. The price has not managed a single confident close above this line since the start of the correction, confirming weak buyer initiative.
- EMA-50 ($0.715), EMA-100 ($0.741), and EMA-200 ($0.758) retain a descending order, though with similarly softening angles. This may indicate a stable bearish structure in which any recovery will face sequential resistance.
RSI
However, not everything looks strictly negative, as RSI has stabilized around 29.20, confirming it remains in the oversold zone. Since this has persisted for several hours, it potentially forms conditions for an RSI reset even without a strong rebound. A move above 33 on RSI, along with a breakout of EMA-20, may serve as a short-term recovery indicator.
FET Fibonacci Key Zones
- 0.236 ($0.686) overlaps with EMA-20 ($0.678), forming the primary resistance cluster, which has yet to be broken. However, if this zone is broken to the upside with a close and RSI above 33, it may confirm a shift from a short-term downtrend to a neutral phase.
- 0.382 ($0.712) is already located near EMA-50 ($0.715). On one hand, this is the second resistance level that may be even more difficult to break. On the other hand, a confirmed move above this zone would indicate an attempt at a recovery phase.
- Levels 0.5 ($0.733) and 0.618 ($0.754) remain outside the current price range, but with sustained growth and an extended impulse, they may serve as indicators of structural trend reversal and a shift in control to buyers.
📈 Potential Bullish Scenario
- Confirmation. H1 close above EMA-20 ($0.678) and 0.236 Fibo ($0.686) with RSI > 33 and increasing volume.
- Target. Move toward the $0.712–$0.715 range, where double resistance from 0.382 Fibo and EMA-50 is forming.
- Invalidation. Close below $0.645 with RSI < 27 and a new downward candle body below the previous low.
📉 Potential Bearish Scenario
- Confirmation. Sustained move below $0.645 with RSI < 27 and no reaction at support.
- Target. Deeper decline to $0.620–$0.615, with no nearby high-liquidity support levels.
- Invalidation. Return above $0.686 with confirmed volume increase and H1 close above EMA-20 and the 0.236 level.
✅ Potential Entry. Bounce from $0.645 with a bullish pattern (e.g., pin-bar or engulfing) with RSI > 30 and H1 close above $0.660.
🛑 Potential Stop. Below $0.640 or with H1 close below the local June 13 low, with RSI < 27 and volume confirmation.
Want more than just trading fees back? BloFin’s new promotion lets users unlock tech gadgets and luxury prizes — up to a Rolex — based on trading volume. Plus, get 20% cashback up to $500 just for depositing.
Conclusion
At the moment, the price is in a clear consolidation phase, with no confirmed recovery indicators yet. Still, RSI and the slight softening of the EMA structure are forming a potential basis for recovery signals to emerge. The key indicators to watch for a shift to a neutral phase are the $0.678–$0.686 zone (EMA-20 + Fibo 0.236) and a confirmed RSI recovery above 33. Until these are broken, any short-term rebound remains a technical correction within the broader downtrend.


