
QNT holds above $128 – new wave incoming? QNT holds above $128 – new wave incoming? The price tested and bounced from the 0.236 level while holding firmly above the rising EMA-20, with RSI remaining stable. We’re watching for the formation of a higher low and a possible breakout above $134.
Overall QNT Price Structure
Over the past couple of days, we’ve seen a strong impulse move from $109.12. The rally unfolded without any significant pullbacks and followed a clear HH/HL structure, culminating in a local high at $134.91.
A natural but controlled correction followed, bringing the price down to $128.82. The market is now attempting to form a new higher low above the 0.236 Fibonacci level. The $125–$128 zone remains key for maintaining the bullish structure, and recent candle consolidation suggests possible accumulation in the $130–$132 area.
QNT EMA and RSI
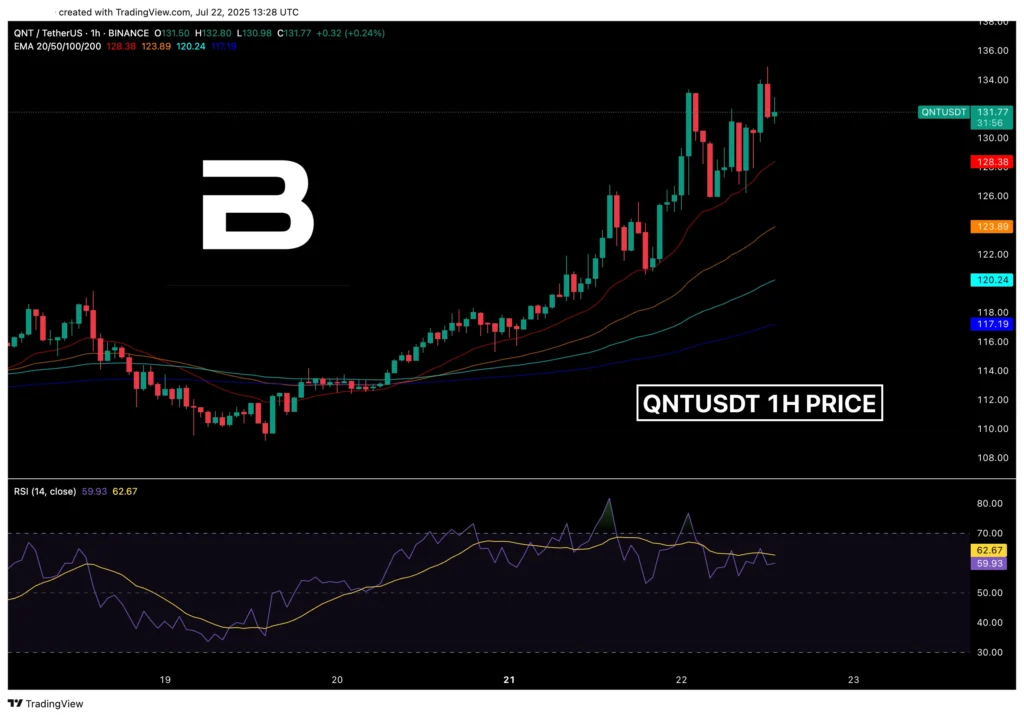
- EMA-20 ($128.38). This level was tested during the pullback and held, resulting in a bounce. It remains a critical short-term support. EMA-20 itself continues to trend firmly upward with an accelerated structure. A break lower would open the way for a test of $125.
- EMA-50 ($123.90). This level hasn’t been tested yet and remains a solid medium-term support. The slope is steadily rising and may become the next HL zone if the pullback deepens.
- EMA-100 ($120.24). Still trending upward and acting as a base for assessing a full retracement of the impulse if this level starts getting tested.
- EMA-200 ($117.19). Far removed from current price action and marks the final zone for maintaining the bullish trend. A break below this level would likely trigger a full phase reversal.
QNT RSI
Currently at 62.67. A constructive signal here is that after peaking above 75, RSI is unwinding gradually without dropping below 50. This supports the view of an ongoing accumulation phase following the impulse.
QNT Fibonacci Key Zones
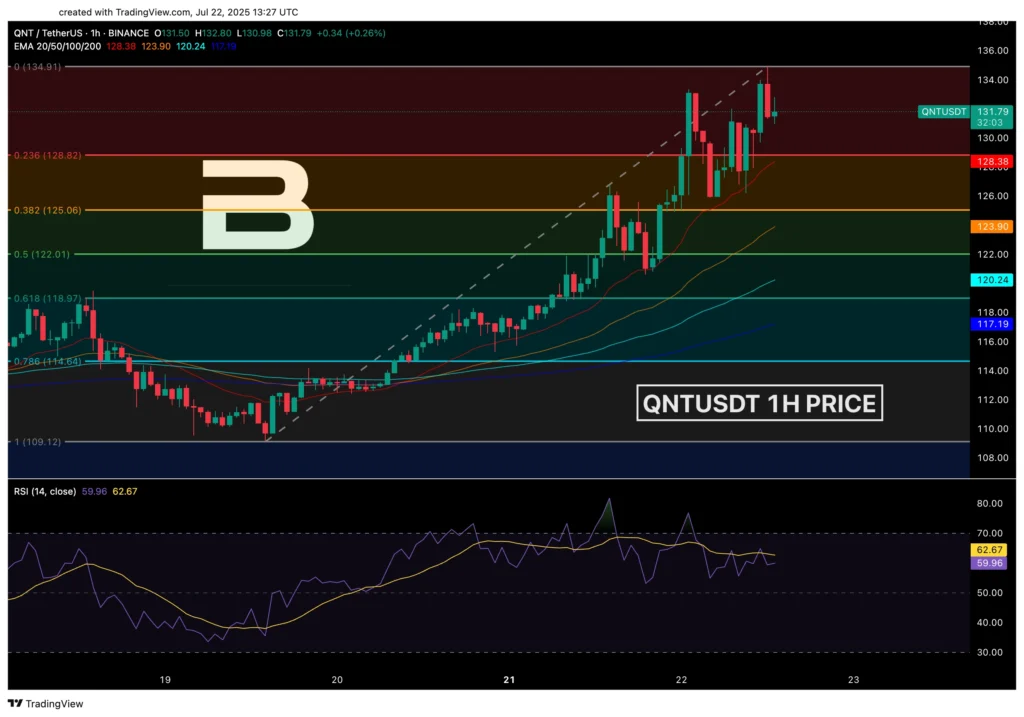
- 0.236 ($128.82). Tested during the pullback and held. Notably, this level also coincides with EMA-20. If this level is lost, it won’t be immediately critical but would open the door to a deeper correction.
- 0.382 ($125.06). A more fragile area, as it’s already below the current HL. A break would signal the loss of short-term momentum.
- 0.5 ($122.01). More significantly, as it aligns with the lower range of the mid-EMA zone. A breakdown here could indicate a potential phase shift.
- 0.618 ($118.97). A critical level located close to EMA-100. Reaching this zone would put the HH/HL structure into question.
- 0.786 ($114.64). The final level marks full unwinding of the impulse. A break below would result in a full invalidation of the bullish setup.
Want even more actionable insights on key events in the crypto industry? Join Trading Legends to access in-depth market analysis, daily trading setups, live sessions with professional traders, a strong community where crypto enthusiasts share trading strategies, experience, and success – and much more!
QNT Market Sentiment
I would assess current sentiment as bullish but moderate, with signs of consolidation. RSI is above 60, the EMA structure remains upward, and HLs have not been violated.
However, momentum volume is decreasing, and the market may be entering a sideways re-evaluation phase. A pullback into the 0.382–0.5 range remains possible without breaking the broader structure. Further upside is potentially viable if a new HL forms and RSI moves above 65.
📈 Potential Bullish Scenario
- Conditions. Close above $133.50 with RSI > 65 and candles showing no upper wicks, supported by rising volume
- Target. Retest of $134.91 and potential extension to $137.50–$139.00
- Invalidation. Break below $125.06 (0.382) with RSI < 55 and loss of the last HL.
📉 Potential Bearish Scenario
- Conditions. Break of $128.82 with confirmed close below EMA-20 and RSI < 58
- Target. Move toward $122.01 (0.5) and then to $118.97 (0.618)
- Invalidation. Hold above $128.82 and reclaim $132.50 with RSI > 62
✅ Potential Entry
Entry around $129.00–$130.50 upon HL formation above 0.236 and RSI > 60
- Trigger. Confirmed bounce from EMA-20 and move back above $131
🛑 Potential Stop
Below $125.00 – beneath 0.382 and EMA-50
- Trigger. RSI < 55, break of the last HL ($128.82), candle close below with increasing volume
QNT – What to Watch in the Coming Hours
The current pullback from $134.91 remains within a normal corrective range and doesn’t yet raise serious concerns about the bullish structure.
Holding $128.82 and forming a higher low above it could act as a continuation trigger. Otherwise, a drop toward $125–$122 will serve as a test of buyer interest.
Keep an eye on price reaction near EMA-20 and RSI behavior in the 60–65 range.


