
Pepe has gone through a lot over the last few days. Like most crypto assets, the memecoin was heavily affected by the news of Israel launching an attack on Iranian soil.
This caused $PEPE to lose its upward momentum, going from $0.000012 to $0.000010 in a matter of hours, effectively losing 12% of its value throughout the day.
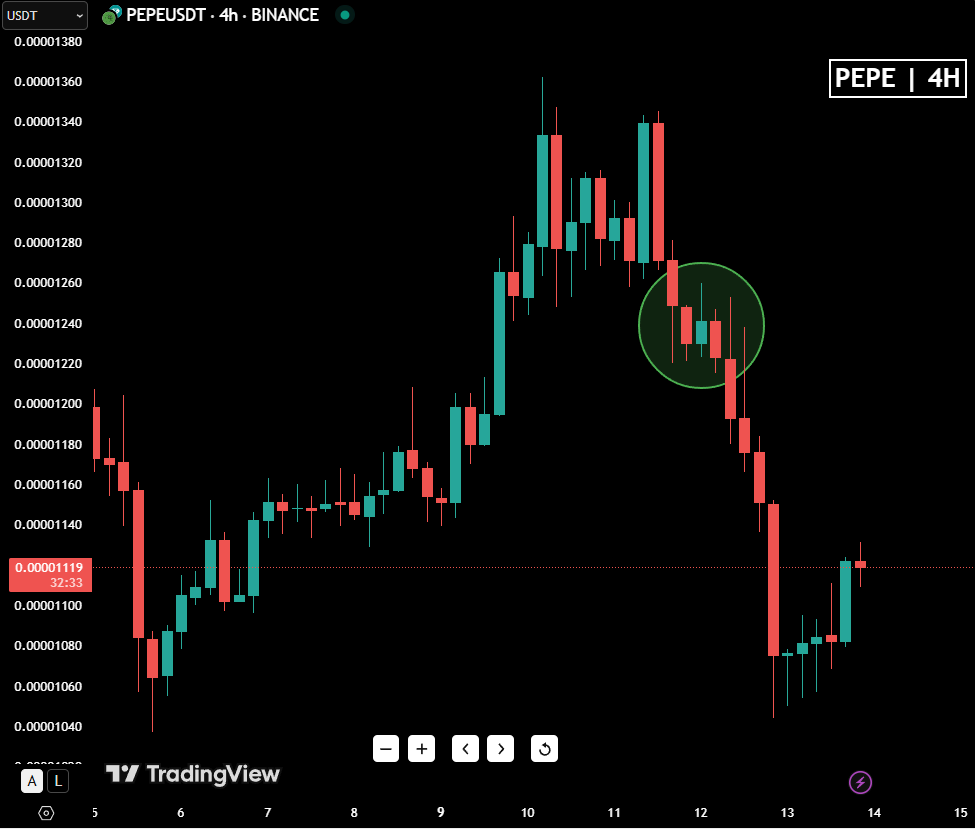
However, the frog memecoin managed to regain some of its momentum this Friday. Currently, $PEPE is trading at $0.00001119, up by around 3% in the last 24 hours.
The fact that the price saw a bear rebuttal at that zone is no coincidence. Drawing a fib retracement from April’s rally, we can see that the $0.00001060 margin is a key zone of interest, serving as a support for Pepe.
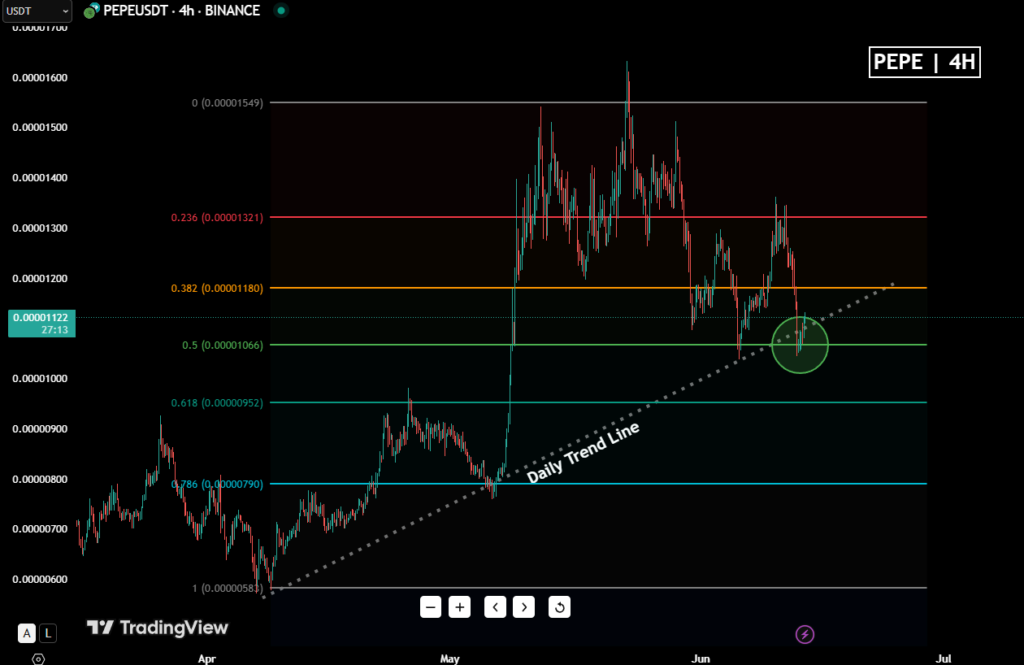
As we can see above, this is the second time this month that the 0.5 Fib zone, or Pepe’s $0.00001060, has served as a support. Also, that zone played a key role as resistance during February of this year, further corroborating its importance in price action.

Price Action Indicators
Given the news that broke yesterday, the market is bound to become a lot more volatile in the short term. For this reason, let’s analyze some indicators to better understand Pepe’s movements.
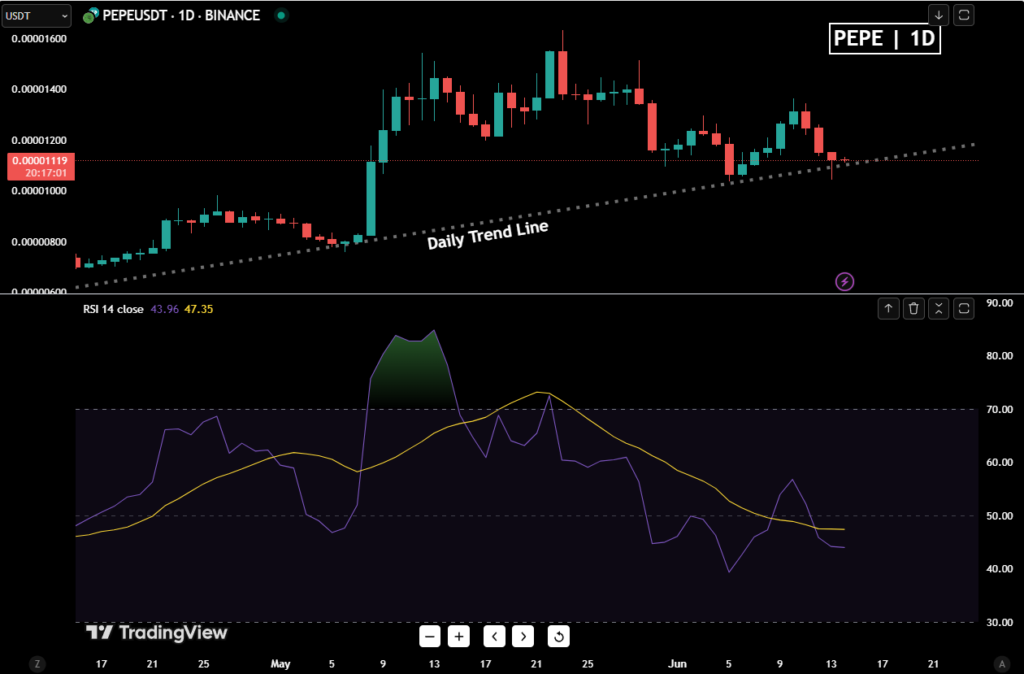
According to the RSI on a daily chart, the price stepped into overbought levels on May 25 at $0.000015. After that, Pepe stepped into correction territory, eventually going to the 50-point RSI level.
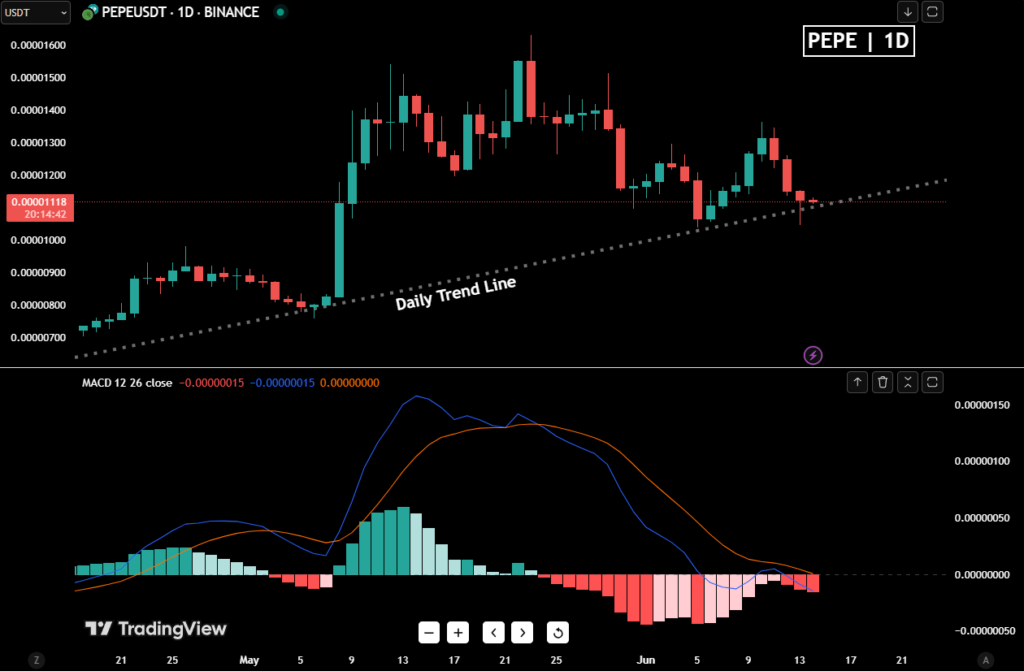
Meanwhile, MACD reinforces just how strong selling pressure became this week, as it completely neglected the fact that the indicator was beginning to step into bullish territory.
Perhaps most importantly, ‘Accumulation/Distribution’ on a daily chart shows us a glimpse of bullish divergence, as investors continued to accumulate Pepe from June 12 onwards, while the value of the coin plunged:
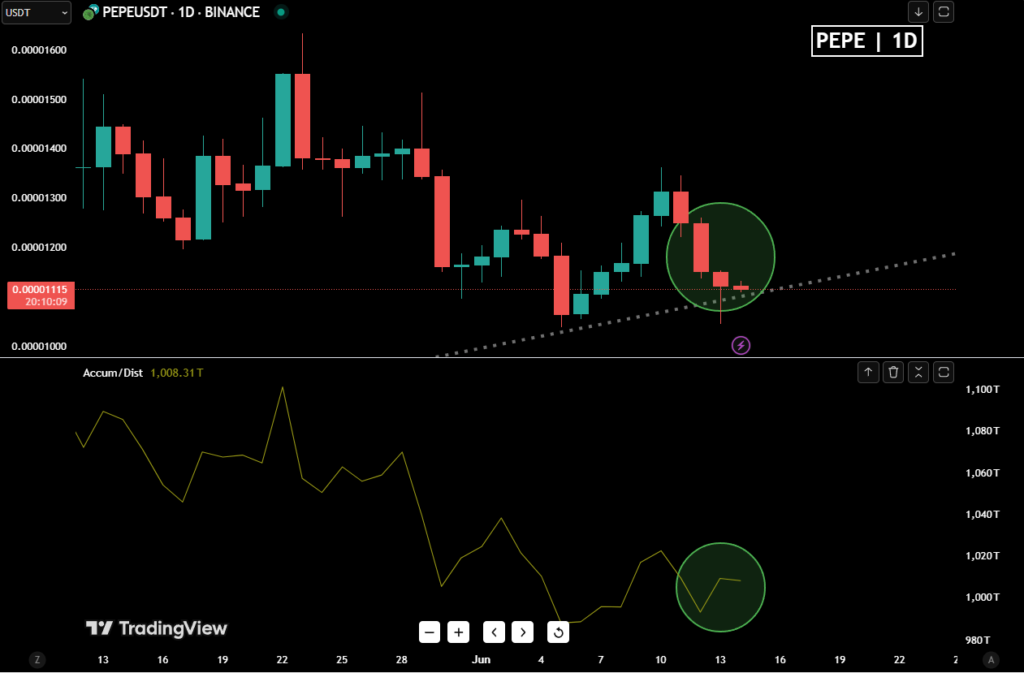
This divergence in the Accumulation/Distribution (A/D) indicator suggests that, despite Pepe’s price decline, buying pressure has been quietly increasing. Typically, when price falls but A/D rises, it signals that investors are accumulating rather than selling off, hinting at potential upward momentum ahead.
Potential Scenarios
The fact that price action is indicating that Pepe just bounced off a support, and technical indicators corroborate the idea that there’s hidden buying strength on the market, could mean that $PEPE will go on to test resistances in the short term.
The first confirmation that we would see in this scenario is $PEPE surpassing the $0.00001140 zone. This could indicate that buyers have enough strength to break above the next Fibonacci zone of 0.382 ($0.00001180), a move that at this time of writing would mean a near 6% growth.
Following that, the next logical zone to keep an eye on momentum would be the $0.00001278 — a margin that faced bearish resistance at the start of the month. Finally, the final zone in this setup, Fib’s 0.236 zone, or Pepe’s $0.0001323 would mean a significant psychological milestone.
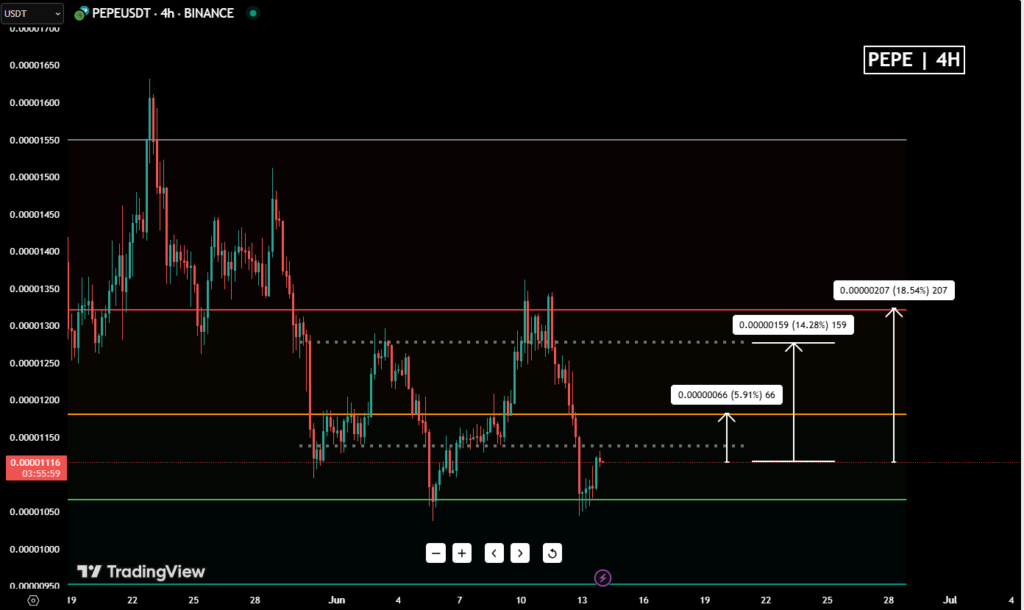
If Pepe strongly breaks above the $0.00001140 zone with clear momentum, this could be a good entry point. A stop loss at $0.00001090 would provide a reasonable risk management strategy, while setting take profits at the zones highlighted in the image above ensures a structured approach to risk management.
What we should keep an eye on is Accumulation/Distribution (A/D) trends, RSI momentum, and overall volume strength to confirm whether buying pressure is truly sustaining this upward move.
Ready to trade? Join WEEX via Bitcoinsensus and get a 20% deposit bonus — with up to 400 USDT waiting for you. Claim your share of the 30,000 USDT reward pool.


