
OKB up 15.5% – breakout or pause after $54.87 peak? Short-term structure suggests momentum, but local resistance remains key. After a sharp move from $47.52 to $54.87, we saw a short-term correction to $52.06. This prompted necessary caution, but the rebound to $53.21, along with upward-sloping EMAs and untested Fibo levels, suggests
Overall OKB Price Structure
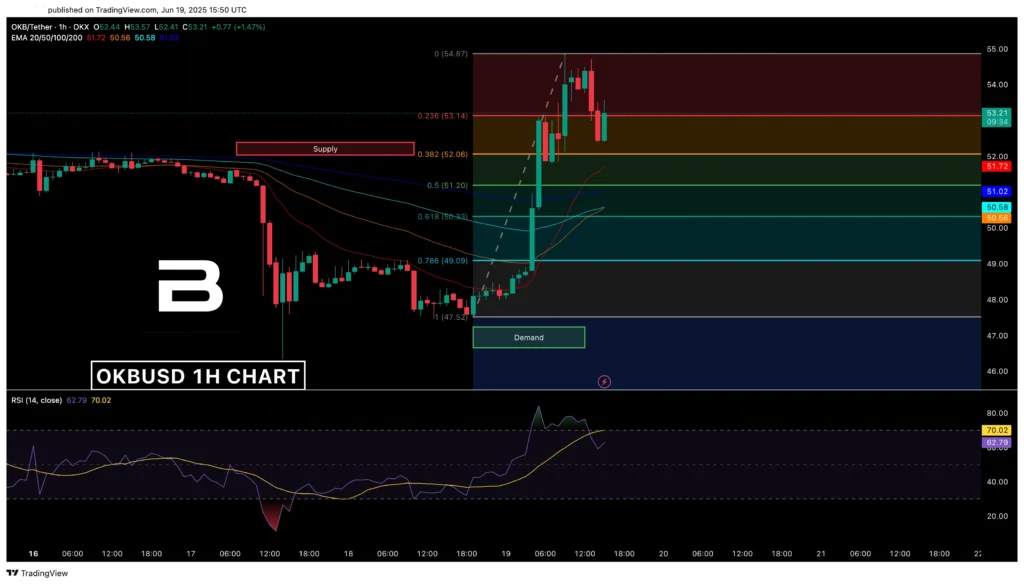
After a sharp impulse move from $47.52 to $54.87, which occurred with almost no correction, we faced resistance with a pullback to $52.06. However, buyers didn’t give up control entirely – we saw a noticeable rebound to $53.16, and all key levels still support the upward trend. At the same time, it’s worth noting that although buyers are still in control for now, the 0.236 level has been tested and is currently acting as a resistance zone.
Trading on BloFin just got a whole lot more interesting. Yes, you read that right: hit the right volume and you could walk away with a MacBook, Apple Vision Pro, or even a $9,400 Rolex. The higher your volume, the bigger the flex.
OKB EMA and RSI
- EMA-20 (51.72). Confidently sloping upward, the angle is clearly positive and remains stable with no signs of slowing. During the correction, the price did not test EMA-20, which may indicate that the impulse is still intact. At the same time, EMA-20 now forms a buffer for a corrective move without breaking the structure. However, a break below EMA-20 could become the first signal of weakening short-term buying pressure, especially if the RSI falls below 60.
- EMA-50 (50.56). The slope is upward but less steep than EMA-20 and serves as an intermediate equilibrium level. EMA-50 also remained untested since the beginning of the move from $47.52 and forms a buffer for a deeper correction without breaking the structure. However, losing this level may indicate a full absorption of the short-term impulse and a shift in control to the sellers.
- EMA-100 (50.58). Almost identical to EMA-50, the angle is positive but less pronounced. Although EMA-100 has not played a role in the current move, it may act as a secondary support line and as the first potential indicator of a shift from correction to reversal if firmly breached.
- EMA-200 (51.02). It’s not often we see EMA-200 fall into the actual short-term impulse zone. A close below EMA-200, especially if RSI is under 58, would give a clear signal of lost medium-term market momentum, may serve as a reversal indicator, and open the way to the $49.0 area.
RSI
After the extreme reading of 79.4, the RSI corrected to 60.5 and then rebounded to 62.79. The angle remains positive but without acceleration, and the RSI MA is at 70.02, with a gap still present. All this may suggest a recovery, but not a full return of momentum. A break above 65 in RSI, along with a price move above $53.14, would provide a potential signal of impulse synchronization. Conversely, a drop below 58 amid pressure around $53.0–53.2 may become the first indicator of a reversal. potential indicators for a continuation of the bullish rally. Let’s take a closer look.
OKB Fibonacci Key Zones
- 0.236 ($53.14). This is now the primary resistance. After the rebound from $52.06 and recovery to the current level of $53.21, 0.236 has been tested. A breakout and consolidation above $53.14, especially with RSI > 65, may serve as the first structural confirmation of a return to the bullish phase. Otherwise, this level will continue to act as a barrier and obstacle to restoring momentum.
- 0.382 ($52.06). This is a key confirmed support zone, as the current rebound started precisely from here. A breakdown below this level would absorb the previous retracement and break the recovery impulse, shifting the balance toward consolidation or a return to lower levels. In particular, a loss of this level with RSI < 58 may signal an exit from the upward structure.
- 0.5 ($51.20). A key level for the bullish trend that defines the boundary of short-term balance: above it – recovery scenarios, below – the risk of entering a retest phase. A drop to this level may lead to another rebound, but a close below it amid high volatility and a negative RSI angle would indicate that the primary initiative is shifting to the sellers.
- 0.618 ($50.33). A key bullish trend level in the case of a deeper correction. If the price breaks below $51.20, then $50.33 becomes the critical point: it may lead either to a rebound with HH/HL recovery or to confirmation of a complete breakdown of the impulse structure. Especially if the loss of 0.618 occurs with RSI < 55, it may serve as a marker of transition to a sustained bearish phase.
- 0.786 ($49.09). The last support zone of the current trend; a breakdown may signal a complete violation of the HH/HL structure. A return to this range would be a sign of buyer capitulation and could open the way to a more prolonged phase of sideways or downward movement.
OKB Market Sentiment
I would describe this as positive with cautious signs of recovery. The bullish structure is intact, RSI is showing a reversal upward from the 60 areas, and recent candles are forming bodies with minimal upper wicks, potentially indicating pressure absorption. The EMA cluster remains well below the price, providing fairly strong support. However, the battle for the initiative is happening right now, and a breakout above $53.14 could return the market to an active growth phase, while a move back below $52.0 would invalidate the current recovery attempt.
📈 Potential Bullish Scenario
- Confirmation. Candle closes above $53.14 (0.236), RSI > 65, no long upper wicks, and EMA-20 remains untested.
- Target. Retest of $54.87 and attempt to break into the $55.5–$56.0 range.
- Invalidation. Breakdown below $52.06 and RSI < 58, with candles showing strong rejection and bodies closing below 0.382.
📉 Potential Bearish Scenario
- Confirmation. Failure to break $53.14, candles with long upper wicks, RSI drops below MA (70.02) with a downward angle, and price breaks below $52.0.
- Target. Test of the $51.20 (0.5) zone → then $50.33 (0.618) and EMA-50. If pressure increases – down to $49.09.
- Invalidation. Holding above $54.00 with RSI > 70 and a clean bullish candle without retracement.
✅ Potential Entry. Possible upon consolidation above $53.14 with RSI > 65 and a full-bodied candle closing above the level. EMA-20 remains below, indicating support.
🛑 Potential Stop. Activated on a return below $51.20 (0.5) and EMA-200, with RSI < 58 and a break in the HH/HL structure on the 1H chart.
Trading on BloFin just got a whole lot more interesting. Yes, you read that right: hit the right volume and you could walk away with a MacBook, Apple Vision Pro, or even a $9,400 Rolex. The higher your volume, the bigger the flex.
Conclusion
The key zone is $53.14: a breakout to the upside could confirm the recovery, while a rejection would indicate strengthening resistance. Support at $52.06 has already held – another test of it will show whether momentum is still intact. RSI dynamics and candle structure in the $53.0–$53.5 range will be decisive: depending on the next 2–3 candle closes, the market will either confirm the bullish continuation or signal renewed distribution.


