
HBAR pullback likely after hitting $0.1800. HBAR has completed a strong upward impulse and entered a phase of local consolidation. So far, indicators are signaling a loss of momentum: RSI is retreating from extreme levels, and volume is declining. The price remains above EMA-20, but the candlestick structure points to a slowdown. How likely is a deeper correction, and what should traders watch in the coming hours? Let’s take a closer look.
Overall HBAR Price Structure
The impulse from $0.15628 to $0.18007, which unfolded over 36 hours, formed a consistent HH/HL structure. After reaching the high, HBAR entered a phase of horizontal deceleration – we can see candles losing body, with a series of short closes and minimal volatility. One of the recent candles also closed with a volume of 116K HBAR, which is significantly lower than previous values.
All of this reduces the likelihood of immediate continuation and increases the probability of a distribution phase. The HH/HL structure is not yet broken, and a bounce is still possible, but a break below $0.171 with a candle body close would be the first signal of a local structural failure.
Between the volatility and the volume spikes, now’s a great time to enter the WOW2025 Grand Prix – a mind-blowing $4.2 million — plus a Tesla Cybertruck rewards await.
HBAR EMA and RSI
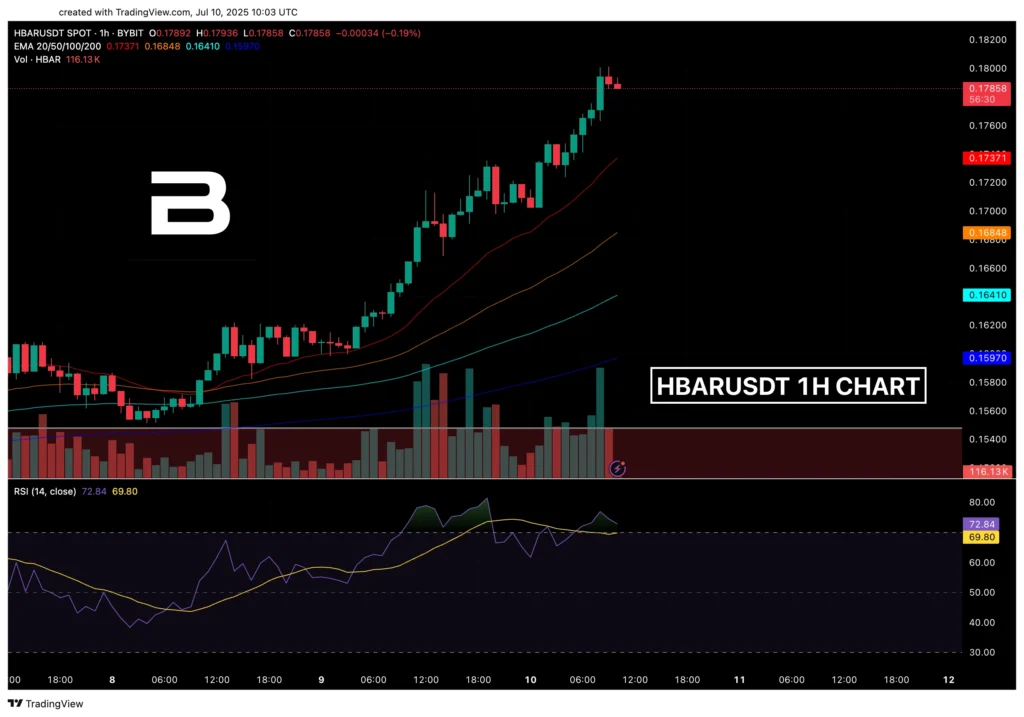
- EMA-20 ($0.17371). Maintains an upward slope, but the rate of growth is slowing. A candle close below EMA-20 on rising volume would confirm the start of a correction phase.
- EMA-50 ($0.16848). The line maintains stable dynamics. This level will be key if the pullback deepens – HL may form here.
- EMA-100 ($0.16410). Supports a smooth upward trend without losing slope. Serves as a potential correction endpoint if EMA-50 fails.
- EMA-200 ($0.15970). Remains below the main structure, and its test is only likely in the event of a deep correction.
HBAR RSI
After peaking near 78, RSI has declined to 72.84. The signal line (69.80) has not yet been crossed, but the slope is negative. A stable divergence is forming – price holds at the high, while RSI moves lower. This increases the likelihood that the local impulse is ending. Confirmation would be an RSI cross below 68, especially if accompanied by a simultaneous price decline.
HBAR Fibonacci Key Zones
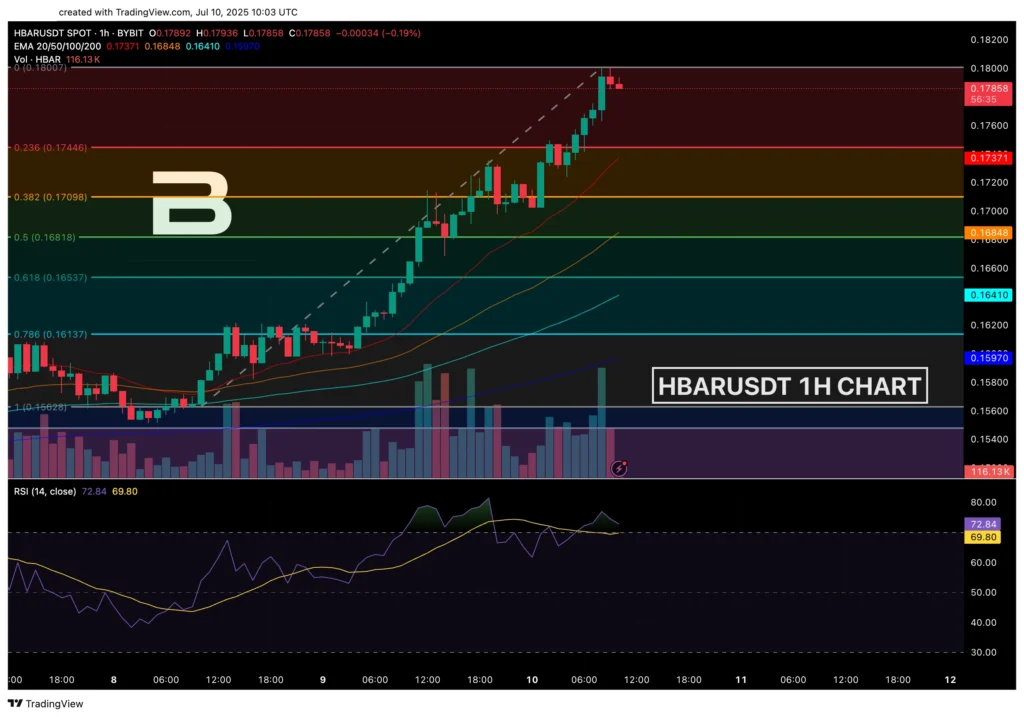
- 0.236 ($0.17446). Price is consolidating slightly above, but a loss of this level on increased volume and RSI < 70 could confirm the initial reversal phase.
- 0.382 ($0.17098). This is a key HH/HL level. A break to the downside may confirm the end of the impulse. However, if volume decreases, a bounce is possible – its strength will depend on RSI.
- 0.5 ($0.16818). This coincides with EMA-50, forming a strong confluence. HL may form here, and a breakdown could mark a short-term structural failure.
- 0.618 ($0.16537). A dangerous zone – essentially a capitulation level. Also, it coincides with EMA-100 dynamics. A quick move into this zone would signal that the impulse has ended.
- 0.786 ($0.16137). Final retracement level of the impulse. A breakdown would mean rejecting the current structure and returning to the mid-term accumulation phase.
HBAR Market Sentiment
The market retains an overheated but weakening profile. RSI is pulling back from the extreme, volume is falling, and candles are losing strength. Price holds at the high without breaking it, while indicators lose momentum. Consolidation above EMA-20 keeps a neutral bias, but an RSI drop below 70 would confirm a phase shift. Thus, holding $0.1745 is critical for continuation.
Want even more actionable insights on key events in the crypto industry? Join Trading Legends to access in-depth market analysis, daily trading setups, live sessions with professional traders, a strong community where crypto enthusiasts share trading strategies, experience, and success – and much more!
📈 Bullish Scenario
Confirmation
- Holding above $0.17446 (Fibo 0.236) for at least 2 candles.
- RSI stabilizes ≥70 and shifts upward.
- Volume rises to ≥ 2.5M with candle bodies > 50% of the range.
Target
- A retest of $0.1800, followed by an impulse extension to $0.1835–0.1850.
Invalidation
- A close below $0.17098 (0.382 Fibo) and RSI < 65.
📉 Bearish Scenario
Confirmation
- Break of $0.17098 and holding below it.
- RSI crosses below 69.80 and moves toward 60.
- Candle body >60% of the range, volume ≥ 2.8M.
Target
- $0.16818 (0.5) → $0.16537 (0.618), then EMA-100.
Invalidation
- A quick return above $0.1745, a candle close above EMA-20, and RSI > 68.
✅ Potential Entry
- Zone $0.1710–$0.1681
Conditions
- RSI ≥ 60
- Reversal candle bouncing off EMA-50
- Moderate volume, no expansion downward
🛑 Potential Stop
- Below $0.1653
Conditions
- RSI < 50
- Candle body closes below 0.618 and EMA-100
- Rising volume and a series of red candles
Between the volatility and the volume spikes, now’s a great time to enter the WOW2025 Grand Prix – a mind-blowing $4.2 million — plus a Tesla Cybertruck rewards await.
What to Watch in the Coming Hours
EMA-20 and the $0.1745 zone are the key indicators for structural continuation. Losing this level with confirmation fromRSI and volume could signal a phase shift. If held, we may potentially see a short-term regrouping and an attempt to return to $0.1800. An RSI < 70 would become a trigger for monitoring volume and candle strength.


