
- HBAR followed our last scenario exactly: liquidity grab and breakout
- Now reacting to an H4 supply that could reject the price lower
- A spike to $0.20 is possible if the price hunts the trendline liquidity above
In our previous hbar price prediction, we laid out a path that might’ve looked “too clean” to be true — accumulation, sweep of the lows, then breakout to grab liquidity above.
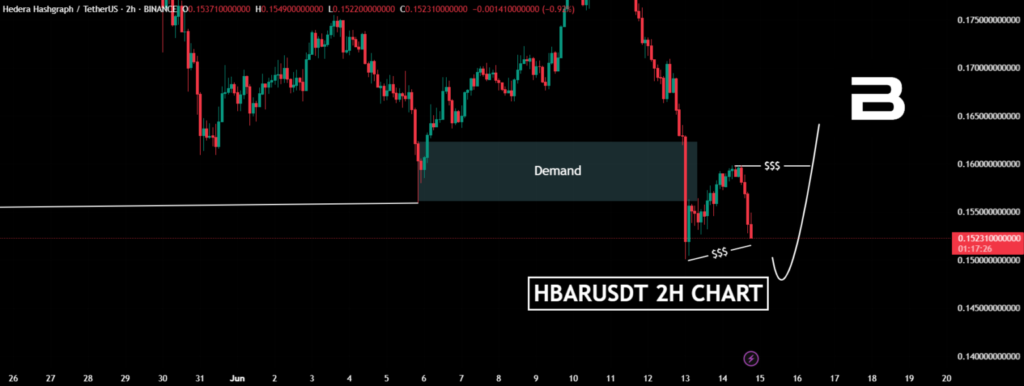
Fast forward: that exact scenario played out to the dot.
No crystal ball here — just understanding how the market moves when it’s hunting for liquidity.
And when it moves with precision, it tells us something. The smart money is always one step ahead, and if you can spot the traps… you stop being the prey.
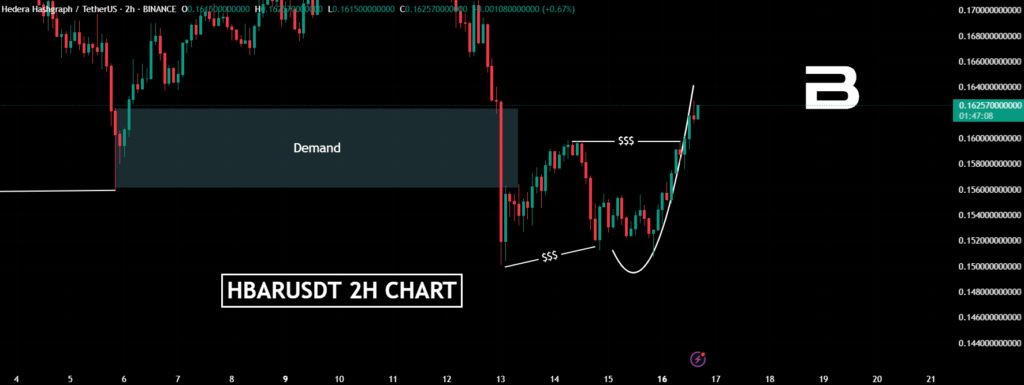
Supply zone in control — or is it?
Right now, on the H4 timeframe, price could react to a clear supply zone.
It’s the same type of level that previously caused strong moves down — and might do it again. A rejection here would make sense technically.

But don’t forget — HBAR is an altcoin, and alts don’t have full control over their destiny. If Bitcoin makes a move, especially a strong one, HBAR could follow — regardless of what this supply zone looks like.
So if you haven’t yet, check out the latest Bitcoin price prediction, because that chart might already be holding the next clue.
But what if HBAR wants more?
Here’s where it gets spicy. There’s liquidity sitting above, aligned with a trendline that’s been building attention for a while. If price decides to grab that — we could see a spike to $0.20.

Would it be aggressive? Yes. Would it make sense from a liquidity perspective? Also yes.
So don’t rule that out. The market is fractal, and sometimes the most unexpected spikes are just the most logical grabs of liquidity.
No certainties, only setups
Like always, we’re dealing with possibilities, not predictions carved in stone. The supply zone could reject. The trendline could get hunted. Or both could be fakeouts.
That’s the market. Our job isn’t to predict with 100% certainty — it’s to recognize scenarios, manage risk, and let the chart tell the story.


