
GRASS rebounds to $1.03 after dropping to $0.96 – will the correction deepen or recovery follow? The current price remains below EMA-20 ($1.0112), and RSI has recovered to 42 but has remained in the neutral zone. Should we expect a consolidation above 0.236 ($1.0253) and a test of the 0.382 Fibonacci ($1.0629), or a deeper correction below the 0 level ($0.9644)?
Overall GRASS Price Structure
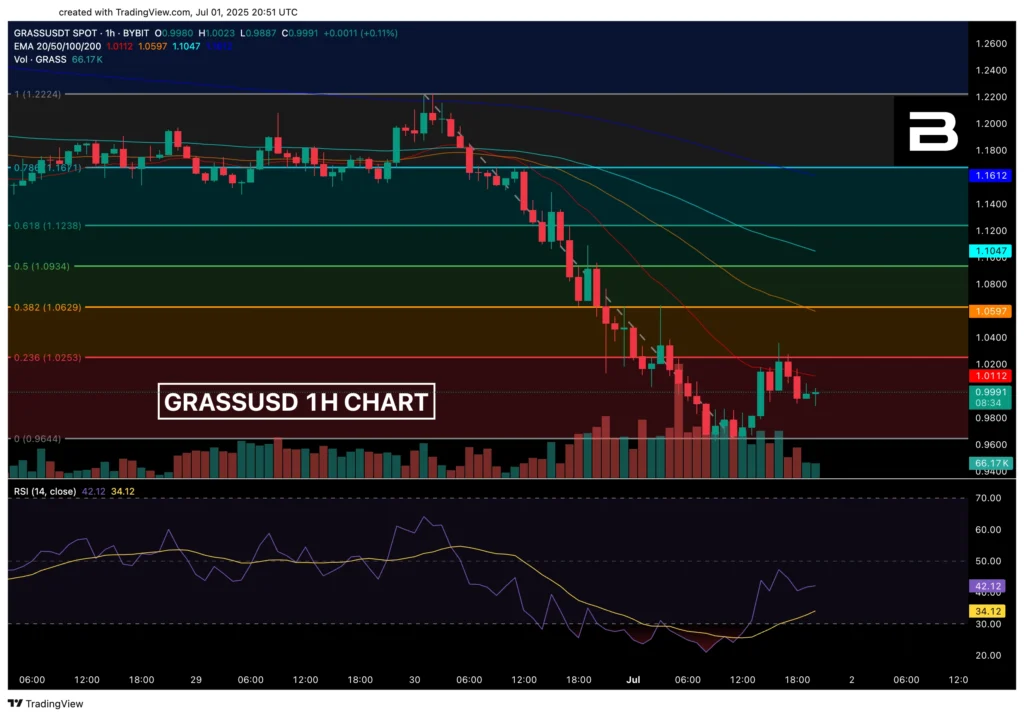
Since June 30, GRASSUSDT has lost 21% of its value, dropping from 1.2224 to 0.9644 on rising volumes. RSI declined to an extreme of 24.7, signaling strong oversold conditions. After reaching the low, a technical bounce followed with a retest of 1.00 and current consolidation in the 0.99–1.02 range. The price recovery is limited by the nearest dynamic resistance EMA-20 and the 0.236 Fibonacci level.
Rising volumes during the 0.9644 test and subsequent rebound indicate capitulation, but the subsequent consolidation shows buyers’ reluctance to force a recovery. To shift this phase, the price must break and consolidate above the 0.236 Fibo and EMA-20.
While GRASS consolidates, thousands are gearing up for the WOW2025 competition on BloFin — where traders can win a Tesla and split $4.2M in rewards.
GRASS EMA and RSI
- EMA-20 (1.0112) moves downward at an angle of –45°, remaining the nearest barrier for bullish attempts; only an hourly close above this curve may indicate weakening short-term bearish control.
- EMA-50 (1.0597) declined at an angle of –30°; breaking and consolidating above it will shift the market into a neutral phase and open the path toward EMA-100.
- EMA-100 (1.1047) continues a gradual decline of –20°, serving as an important mid-term trend marker and requiring significant volume confirmation for a breakout.
- EMA-200 (1.1612) slides downward at a slight angle of –10°; testing this will become a potential indicator of a major reversal only with a change in market perception.
RSI
The indicator recovered to 42.1 after hitting a low of 24.7, showing a positive angle and easing oversold conditions. However, the indicator remains below 50, indicating continued bearish sentiment. Also, RSI bullish divergence may signal weakening sellers. Yet, reversal confirmation requires RSI breaking above 50, whereas a repeated fall below 30 will strengthen bearish pressure.
GRASS Fibonacci Key Zones
- 0.236 (1.0253). First correction target located slightly above EMA-20 (1.0112). Holding price above this mark on an hourly close will signal the start of a meaningful rebound.
- 0.382 (1.0629). “Decision point,” coinciding with EMA-50 (1.0597). Breaking this zone confirms disruption of the short-term descending impulse.
- 0.5 (1.0934). Mid-point of the retracement wave, lying near EMA-100 (1.1047). Reaching this mark will indicate a significant balance shift towards buyers.
- 0.618 (1.1238). Deep correction, convergent with EMA-100 and EMA-200. A rejection from this zone preserves the mid-term downtrend, while a sustained breakout could shift the market into a serious recovery phase.
GRASS Market Sentiment
Sentiment remains bearish with signs of local consolidation. The price trades in a narrow range of 0.995–1.025 amid decreasing volumes, and RSI shows initial recovery. Without volume confirmation, overcoming resistance will be difficult.
📈 Potential Bullish Scenario
- Confirmation. Hourly close above 1.0253 (0.236 Fibo) and EMA-20 (1.0112) with RSI ≥ 45, supported by a bullish engulfing candle or strong pin-bar on rising volume.
- Target. Test of the 1.0629 zone (0.382 Fibo / EMA-50), a breakout of which sets the next target at 1.0934 (0.5 Fibo).
- Invalidation. Return of the price below 1.015 with RSI < 40 and formation of a series of lower highs under EMA-20.
📉 Potential Bearish scenario
- Confirmation. Holding below 0.995 amid rising sell volumes and RSI < 32, indicating a renewal of the bearish phase.
- Target. Retest of 0.9644 with potential continuation toward 0.9200 1.272 Fibo.
- Invalidation. Sustained hourly close above 1.0629 with RSI > 50 and formation of a higher-low above 1.0253.
✅ Potential Entry
1. On hourly close between 1.0112 (EMA-20) and 1.0253 (0.236 Fibo) with RSI > 45 and confirming candle pattern.
2. After sustained hourly close above 1.0629 (0.382 Fibo) and EMA-50 (1.0597) with RSI > 55 and rising volumes.
🛑 Potential Stop
1. Decline below 1.0112 (EMA-20) and 1.0253 (0.236 Fibo) with RSI < 40.
2. Return under 1.0597 (EMA-50) and 1.0629 (0.382 Fibo) with RSI < 45.
While GRASS consolidates, thousands are gearing up for the WOW2025 competition on BloFin — where traders can win a Tesla and split $4.2M in rewards.
Conclusion
Key levels currently are the 1.0112–1.0253 zone (EMA-20 and 0.236 Fibo). A volume-backed breakout above may activate a test of 1.0629 (0.382 Fibo), while holding below and RSI turning downward will increase pressure toward 0.9644. Focus on volume dynamics when approaching these zones and RSI behavior around the marks.


