
ETH on the verge of breaking $3.65K – is the recovery intact? Bulls held 0.5 and EMA-20 – the next target is above $3.66K. Let’s assess whether signals are pointing to a renewed bullish structure or a shift into correction.
Want to trade like a VIP from day one? Get up to $30,000 in welcome perks right now. This welcome deal from WEEXgives you more than just a bonus — it gives you a serious head start.
Overall ETH Price Structure
What have we seen recently? The impulsive downside phase led to a break of the key $3,600 support and a test of the 0.786 Fibo zone at $3,545, where a local low formed at $3,543 with a long lower wick.
Do you see that sharp rebound from that point, breaking through 0.5 ($3,588) and 0.382 ($3,606)? This may point to an attempt to recover the structure.
However, note that the current high ($3,645) still hasn’t taken out the previous local highs, meaning the HH/HL structure remains broken.
Still, holding above 0.382 and consolidating near EMA-20 may give us grounds to consider a possible shift toward a bullish phase, provided we break and hold above $3,650.
ETH EMA and RSI
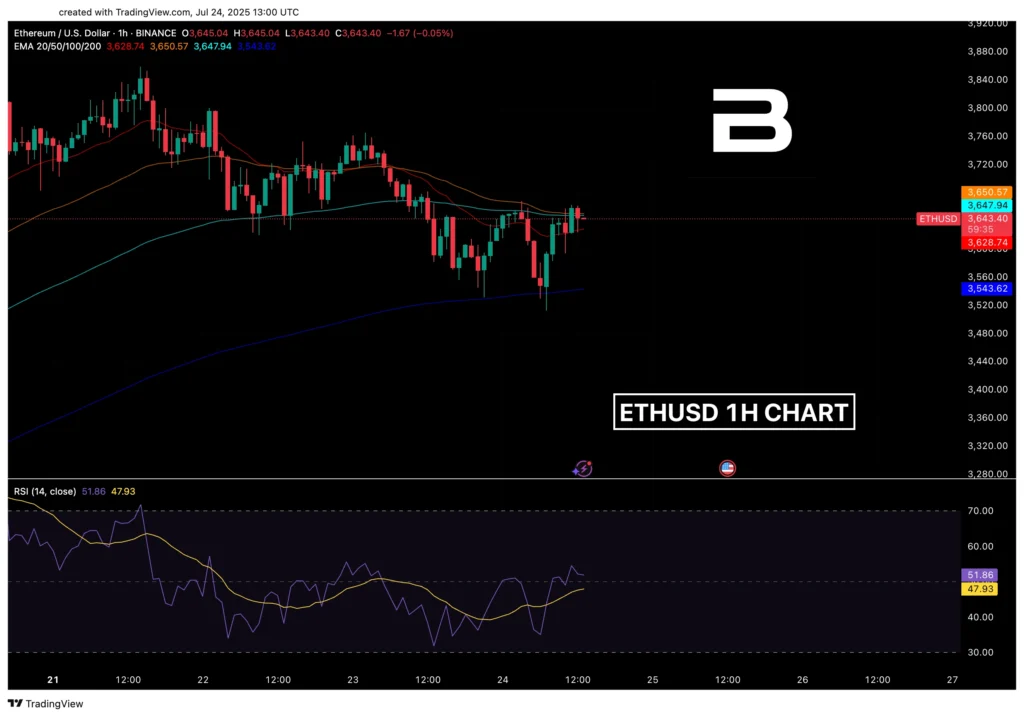
- EMA-20 ($3,628.74). Unfortunately, it’s flat and being tested from below. Still, a couple of candles close above it could give us a signal for the return of the short-term bullish impulse and cancellation of the local corrective phase.
- EMA-50 ($3,650.57). Even more unfortunately, it’s sloping downward. That said, a break and close above it would create conditions for a test of $3,662.
- EMA-100 ($3,647.94). It’s now acting as immediate resistance, and if ETH closes above it, we could get a signal for a trend reversal.
- EMA-200 ($3,543.62). This level coincides with the base of the rebound and tells us that the long-term trend is stillintact. However, it’s critical – a break below would send the asset back into selloff territory.
ETH RSI
Right now, we’re at 51.86, with a positive, upward slope and no clear signs of slowing. Also note that RSI crossed above its MA from below, which could give us a signal for potential recovery. At the same time, there’s no immediate threat of breaching 70, which suggests the rally could continue without overheating.
ETH Fibonacci Key Zones
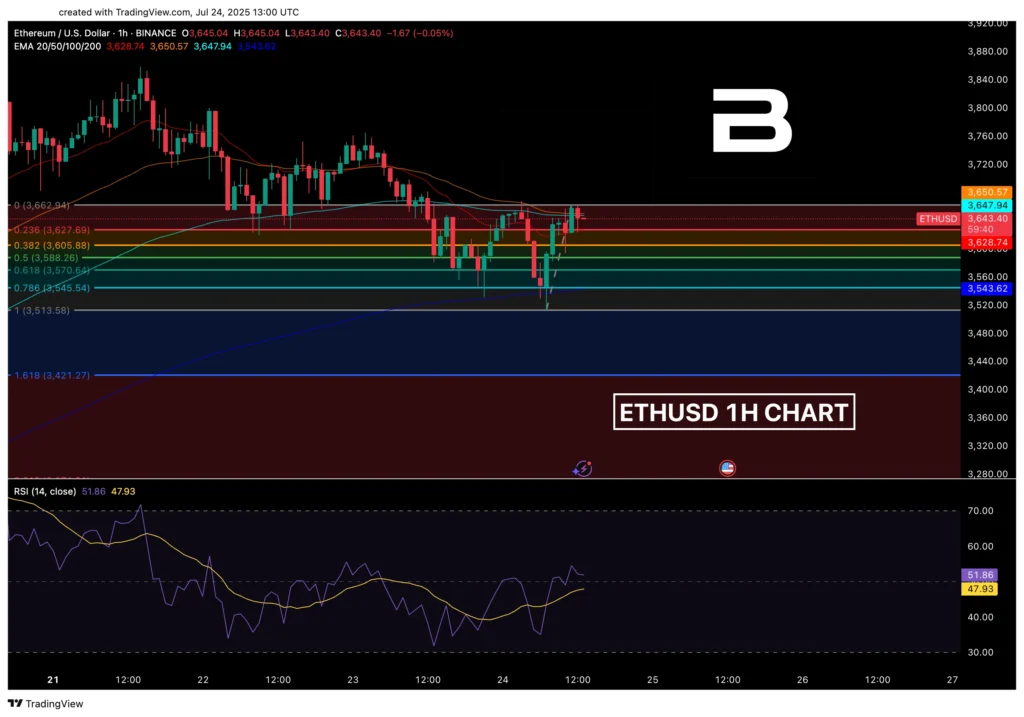
- 0.236 ($3,627.69). This level was broken by the short-term impulse, and that’s especially important when combined with EMA-20. A hold above it opens the door to $3,662. A fresh rejection downward would confirm the resistance we still need to deal with.
- 0.382 ($3,605.88). We held this level after the retest. It’s now the key support within the current recovery phase. Losing it would be the first sign of weakening short-term momentum.
- 0.5 ($3,588.26). This used to be our consolidation zone after the initial bounce, and now it’s been confirmed by several candles closing above it. If we lose this one, that could be a potential signal for a mid-term trend break.
- 0.618 ($3,570.64). That’s the level from which the final rebound occurred. If the price returns to it, we might have to question the whole recovery, especially if RSI drops below 48.
- 0.786 ($3,545.54). This level aligns with EMA-200. Losing it would mean a breakdown of the entire bullish structure and a return to $3,513.
Want even more actionable insights on key events in the crypto industry? Join Trading Legends to access in-depth market analysis, daily trading setups, live sessions with professional traders, a strong community where crypto enthusiasts share trading strategies, experience, and success – and much more!
ETH Market Sentiment
I’d say sentiment is moderately bullish. RSI has moved back above the MA, EMA-20 is being tested from below, and the Fibo structure confirms a rebound from a deep zone.
That said, the lack of a solid hold above EMA-50 and continued pressure around $3,650 are capping the impulse. On the candles, we’re seeing short bodies and long upper wicks – a clear signal of resistance near the upper boundary of the channel.
📈 Potential Bullish Scenario
- Confirmation. 1H candle closes above EMA-20 ($3,628) and EMA-100 ($3,647), with RSI > 55.
- Target. A test of $3,662, with a possible move toward $3,700.
- Invalidation. A pullback below 0.5 ($3,588) and RSI < 48, with a candle body closing below EMA-20.
📉 Potential Bearish Scenario
- Confirmation. Rejection from $3,650, bearish candle closing below $3,605, and RSI < 47.
- Target. A return to $3,570 (0.618), then a test of EMA-200 at $3,543.
- Invalidation. A break and hold above $3,650, with RSI above 55 and EMA-50 reclaimed.
✅ Potential Entry
- Zone. Between 0.382 ($3,605.88) and EMA-20 ($3,628.74).
- Conditions. RSI > 50, confirmation via candles with long lower wicks and closes above EMA-20 – ideally also backed by volume and a climb above MA RSI.
🛑 Potential Stop
- Zone. Below 0.5 ($3,588.26) and EMA-20.
- Conditions. RSI < 48, break below EMA-20, large-bodied bearish candles.
- Invalidation. A close below 0.618 ($3,570.64) would confirm the impulse breakdown.
Want to trade like a VIP from day one? Get up to $30,000 in welcome perks right now. This welcome deal from WEEXgives you more than just a bonus — it gives you a serious head start.
What to Watch in the Coming Hours
Let’s watch the $3,650 zone closely. A breakout and hold with volume and RSI above 55 could give us confirmation of a potential phase shift.
If there’s a rejection and the price moves back below 0.5, we should be alert for renewed downside pressure toward $3,570. The HH/HL structure will only be restored once $3,662 is cleared and a new local high is formed.


