Table of Contents

In yesterday’s Bitcoin analysis, I identified and analyzed the bullish inverse head and shoulder pattern that was forming on the Bitcoin cryptocurrency.
I also pointed out the entry confirmation I was watching for as well as the target regions I was aiming for the Bitcoin price to get to before reversing.
The Result Of The Bitcoin Prediction?
Well, price followed that exact prediction perfectly, and today we saw the Bitcoin price break and close above the inverse head and shoulder neckline line, confirming my entry and announcing the start of the short term bullish move within the overall falling wedge pattern price has been trading in for a few weeks now.
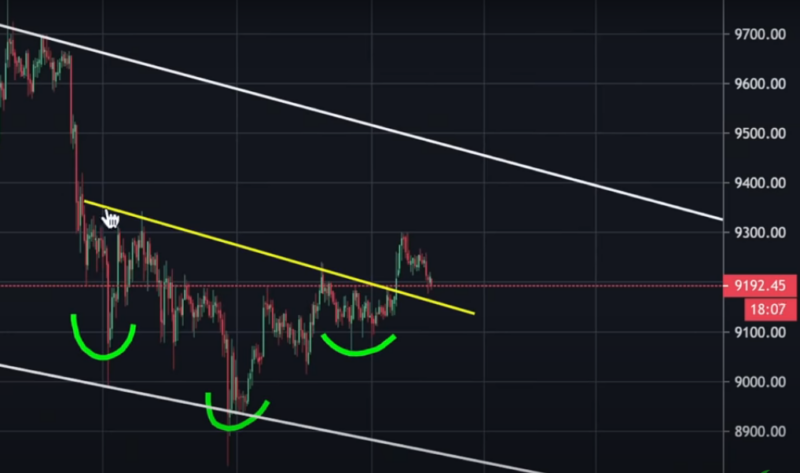
However, the low bullish volume and the high selling pressure at $9,300 (A level I pointed out in my previous Bitcoin analysis) served as a major resistance for the Bitcoin price.
This prevented the Bitcoin price from reaching the top of the falling wedge channel, which I pointed to in my previous bitcoin analysis as my main target region for this bullish move.
Since the price reversal at the $9,300 price region, Bitcoin as being crashing, breaking important support regions, and gathering bearish momentum.
Is This The Start Of The Bearish Trend. What Next?

It is important to keep an eye on the bigger picture for Bitcoin because even though the price is currently crashing towards the $8,000 support region, Bitcoin is still trading in a falling wedge pattern.
And as the day go by, we might see the base channel of the falling wedge pattern become very strong support that the bitcoin price might bounce from and begin heading higher again.
Important Price Levels I Am Watching

Bitcoin, as broken through the $9,000 support region and, is currently testing the $8,900 price region.
This price level is very important as it as served as both support and resistance for the Bitcoin price on numerous occasions in the past. A break below it would leave Bitcoin with no major support to bounce off of and we could see the Bitcoin price crashing as low as $7,000 in the coming weeks.

This $8,900 price region also serves as the base of the fallen wedge pattern Bitcoin has been trading in. And although this pattern is a bullish pattern, we might see price break below and keep heading lower in the coming days.
A More Bullish Outlook If $8,900 Support Holds
If the $8,900 support price level holds, we can expect to see the Bitcoin bulls step back and push the Bitcoin price back up to the $9,000 to $10,000 resistance region in the coming days.

To gain more information on how to partake in this coming Bitcoin Bear run and trade this cryptocurrency, you can read my bitcoin leverage trading guide and follow my daily bitcoin analysis. You can also check my top list of bitcoin exchanges to trade with.