Table of Contents
In my previous Bitcoin analysis titled “Bitcoin Hidden Bullish Pattern Fail. Crash To $7,000?“, I talked about the importance of the $8,900 support region and how a price break or bounce off of this region could dictate what the Bitcoin price will do for the short term.

Well today, we saw the $8,900 support region hold strong as Bitcoin buyers came back into the market and pushed the Bitcoin price back up into the $9,000 region. But the big question most traders are asking right now is “where is the price actually heading to now?”
In this Bitcoin analysis, I will be answering that question and also revealing the current bullish pattern forming on Bitcoin. I will also be pointing out the price levels I will be looking out for and my likely targets for the short term bullish move.
Target 1: Bitcoin Still Trading In A Falling Wedge Pattern

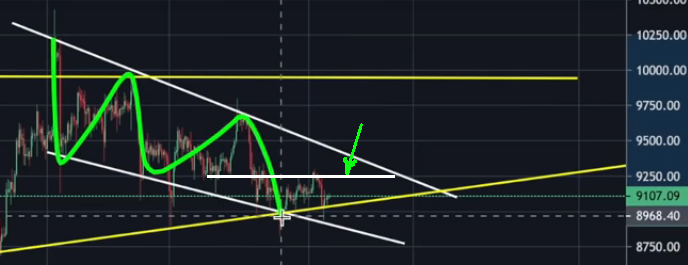
It is important to remember that the Bitcoin price is still trading in a falling wedge pattern and the bullish price bounce we saw today was Bitcoin testing and then rejecting the base channel of that falling wedge pattern.
And according to my predictions, I believe the bitcoin price as a very high likelihood of rising to touch or breakthrough the top of the falling wedge channel in the coming days. So my first likely target for this current bullish move is a retest of that channel.

It is also important you watch out for the resistance level at the $9,200 region as the price might get to and reject this level in the coming days. However, if the Bitcoin price breaks through it, the next target can then be the top of the falling wedge channel.
Target 2: A larger Head And Shoulder Pattern Forming

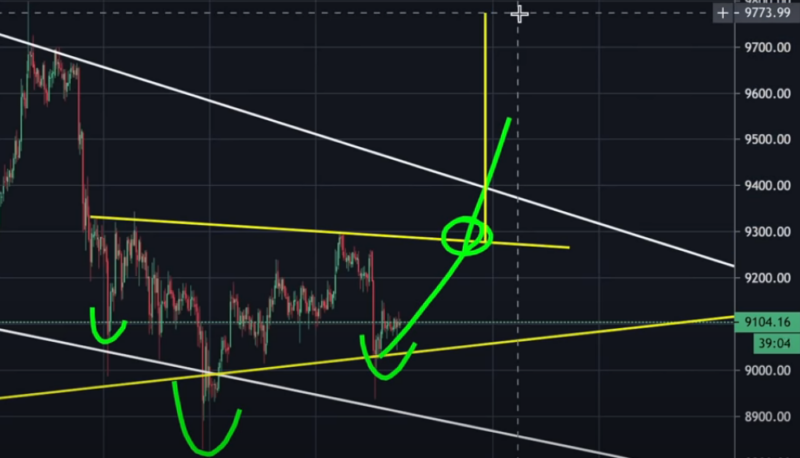
Bitcoin is currently forming a larger Head and Shoulder pattern on the one-hour timeframe. The pattern is very bullish however, it is yet to be completely formed. For it to be completed I must see a break of the head and shoulder neckline.

A break of this neckline could mean we might see a larger Bitcoin rally above the falling wedge top channel.
My exact target is $9,773. The price target is gotten by measuring the distance from the Head to the Neckline of the pattern and then projected upward.
An Increased Trading Volume Is A Must!
One of the most important things I am looking forwards to happening once the breakout and close above the neckline occurs is “an increase in trading volume”.
If there is no sufficient increase in the bullish trading volume, we might just see the Bitcoin price do a fakeout or test and reject that falling wedge top channel before crash back down.
To gain more information on how to partake in this coming Bitcoin Bear run and trade this cryptocurrency, you can read my how to make money trading bitcoin Guide and follow my daily bitcoin analysis. You can also check my top crypto exchange list to trade with.


