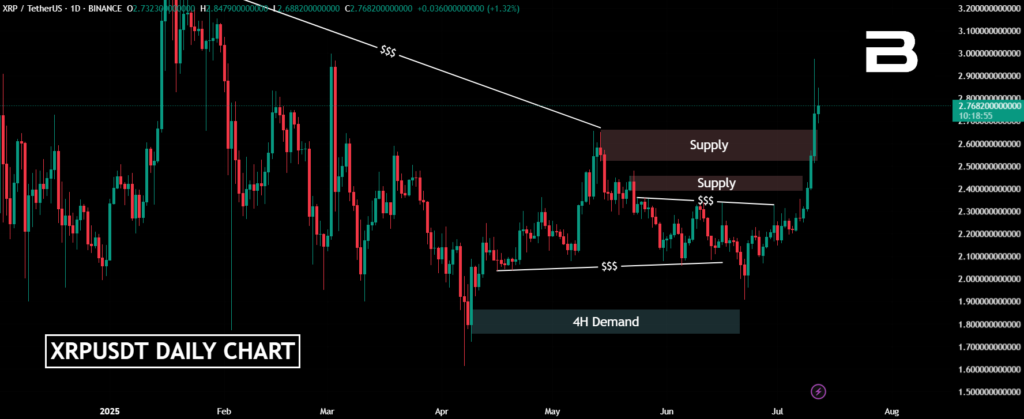
- XRP hit $3 after a textbook accumulation-manipulation-breakout move
- High timeframe liquidity ruled over short-term supply zones
- M15 shows both a risky short and a strong demand, but volatility is high and uncertainty remains
It finally happened—XRP almost touched $3 again.
After what felt like an endless phase of uncertainty and sideways movement, the price exploded upward. And if you were paying attention on June 24th, maybe this move didn’t catch you entirely off guard.
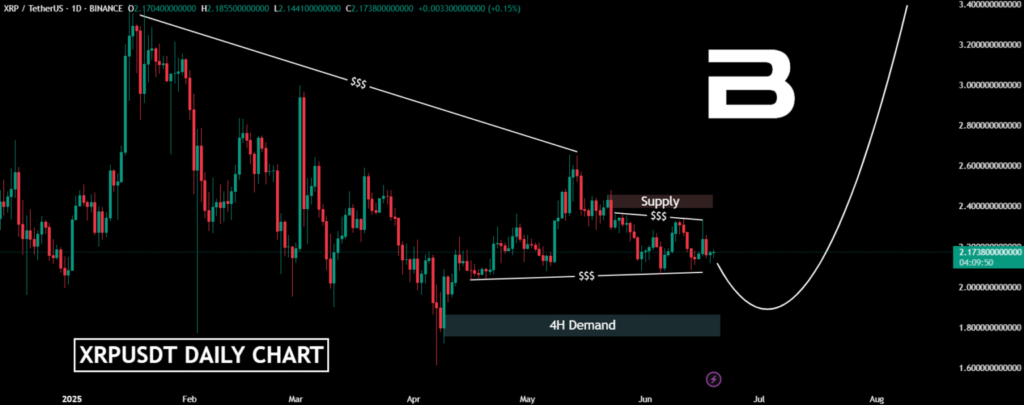
Back then, we noted how XRP had been accumulating liquidity both above and below, and it looked primed for one last dip before any meaningful breakout.
That’s exactly what it did. It manipulated the downside, shook out the weak hands, and then blasted off like it had been waiting all year for the green light.
And now, with the price at these elevated levels, the real question kicks in: Where do we go from here?
Smart Money Behavior and High Timeframe Priorities
One thing this move has made very clear: higher timeframe liquidity matters more than the noise on the smaller charts.
When XRP started its slow climb, many (me too) thought that one of the overhead supply zones would cap the rally.
It seemed like the perfect moment for a pullback. But that didn’t happen. The price ignored minor supply pockets and headed straight toward the liquidity that had been sitting above on the weekly and daily timeframes.
This kind of behavior isn’t random—it’s textbook. When a coin like XRP accumulates for that long and manipulates beneath a range, the next logical step is a move to clear inefficiencies and sweep the highs.
That’s exactly what we’ve seen.
Short-Term Views: Risk, Supply, and Demand
Now, if you’re zooming in—let’s say to M15—there’s a different story unfolding.
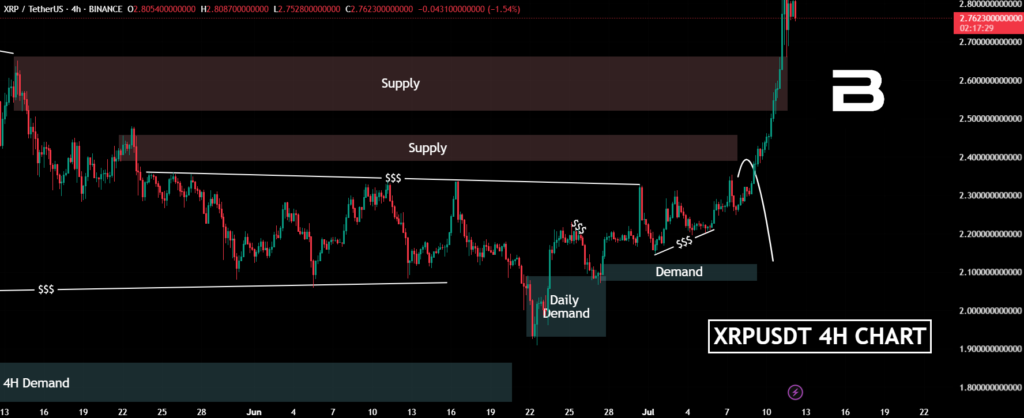
Price just ripped through a lot of structure, and now it’s sitting close to a supply zone with imbalance.
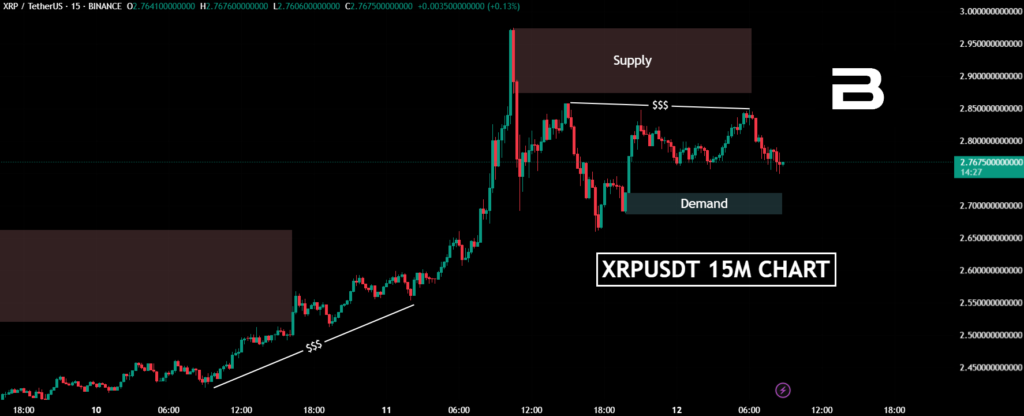
That zone is right above a trendline where lots of traders are placing stops. So yes, the temptation to short here is strong, especially if you’re looking for a quick trade.
But let’s keep it real—there’s also a fresh demand zone sitting just below. And beneath that, there’s still a ton of untouched liquidity. That means this setup is no place for oversized positions or reckless trades.
If the price wants to pull back, that demand could be a place to watch. But if the momentum continues, don’t be surprised if XRP keeps printing higher highs without even glancing back.
This Is Not a Coin Flip… It’s Worse
If you’ve traded XRP before, you know how wild it can get. It loves to trap, fake, and punish.
It’s not about guessing. It’s about planning scenarios. If you’re long, manage your stop. If you’re shorting resistance, know it’s risky with Bitcoin in ATH zones. XRP can move fast, and pretending to predict every tick is how accounts get wrecked.
Final Thoughts on the XRP Price Prediction
So, here’s the honest take: XRP almost hit $3, and that was a massive psychological and technical level. Now, the chart is showing conflicting signals depending on what timeframe you’re living in.
If we stay bullish, $3 could become new support, and the price might hunt stops above even more aggressively. But if the market breathes out, expect a revisit of some of those demand zones we talked about.
Either way, XRP price prediction from here depends on how the market handles this breakout zone. Watch the imbalances. Respect the liquidity. And above all, don’t assume you know what happens next—because the price absolutely doesn’t care.


