
Bitcoin ATH $118K to $117K: dip finished? After hitting a new all-time high with RSI 80+, BTC rebounds from first support as bulls eye $120K next target. The current recovery to $117,585 raises the key question – is this a bounce for continued growth or part of a deeper corrective structure toward the 0.382 zone?
Between the volatility and the volume spikes, now’s a great time to enter the WOW2025 Grand Prix – a mind-blowing $4.2 million — plus a Tesla Cybertruck rewards await.
Overall Bitcoin Price Structure
Bitcoin’s price structure demonstrates the completion of an impulse phase with a transition into a corrective wave. We observed the beginning of this strong movement from July 9 at $109.4K, through consolidation at $111-$112K to the final impulse to $118.3K. The impulse was quite powerful, so we encountered an inevitable correction with a sharp decline to $116.2K. However, we then saw a quick recovery to $117.5, indicating a rather tense situation and high volatility. Right now, we are observing a struggle for initiative between buyers and sellers.
Want even more actionable insights on key events in the crypto industry? Join Trading Legends to access in-depth market analysis, daily trading setups, live sessions with professional traders, a strong community where crypto enthusiasts share trading strategies, experience, and success – and much more!
Bitcoin EMA and RSI
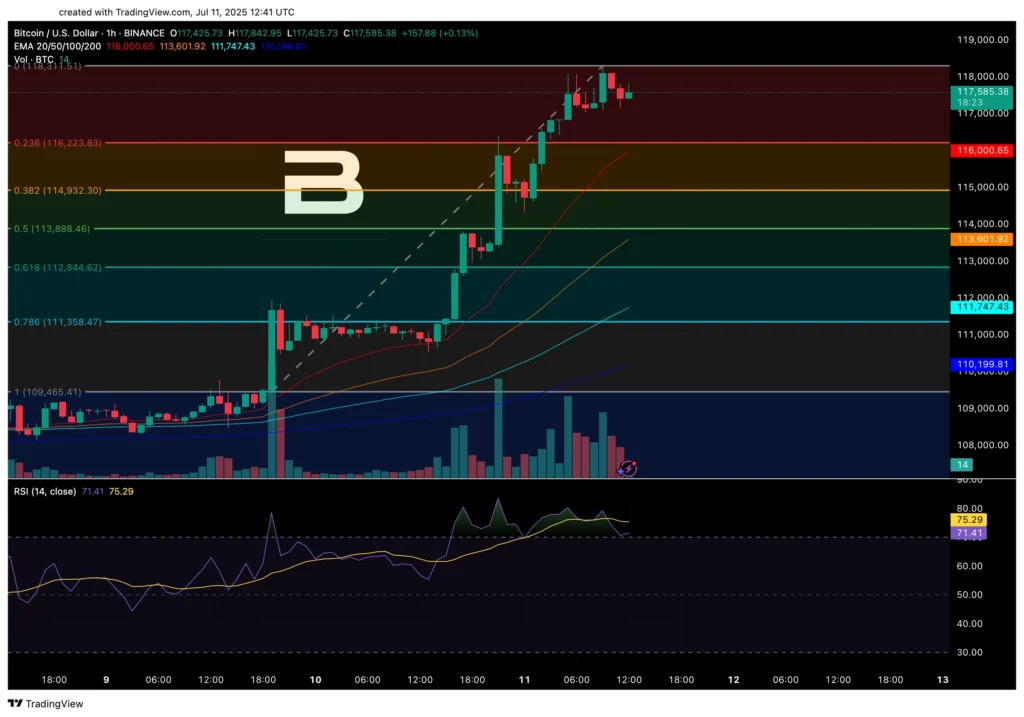
- EMA-20 ($116,006). Crossed upward by price after the test. The slope angle is transitioning from vertical to horizontal – a typical reaction to impulse completion. Consistent consolidation above with restoration of the upward angle will open a direct path to $118.3K. A downward break with the angle turning negative will trigger acceleration to $114.9K.
- EMA-50 ($113,604). Located noticeably below the current price, but the slope angle is strengthening. A downward break will activate mass retail long stops, opening targets of $112-$111K. An upward bounce from the test will form a classic re-entry point for the late cycle.
- EMA-100 ($111,748). Located in the impulse start zone. The slope angle is moderately ascending, confirming the presence of accumulation at these levels. Consolidation below will break the weekly trend structure. A bounce will create a double bottom for a multi-week rally.
- EMA-200 ($110,199). The last bull’s stronghold on the current timeframe. The angle is barely positive, and the line is just beginning to react to the movement. A downward break may shift the market into a bear market on H1. Holding above will preserve the long-term structure for movement to $125K+.
RSI
Current level 71.41, decline from the 80+ peak is occurring at a ~30 degree angle – controlled unloading without panic. Stabilization above 70 during price sideways movement may become an accumulation before the next impulse. A break below 65 will activate algorithmic momentum selling. Divergence is absent, but when testing $118,311 without exceeding RSI 80, a classic bearish divergence will form – a signal for distribution.
Bitcoin Fibonacci Key Zones
- 0.236 ($116,223.83). Broken and recovered – classic bear trap. A retest may clarify – a bounce will make continuation to ATH possible, a break will open the path to $114.9K.
- 0.382 ($114,932.30). Golden pocket for buyers. Institutional limit bids are concentrated here. A downward break may break algorithms and trigger a cascade to 0.5.
- 0.5 ($113,888.46). Center of trend movement. A bounce from here can still target $120K, while a break opens $110K.
- 0.618 ($112,844.62). Bulls’ last hope. Coincidence with the zone between EMA-50/100 creates triple support. However, a loss may become a break for the entire short-term uptrend.
Market Sentiment
We can say that we are now observing controlled greed with notes of uncertainty. Volume on the bounce from $116,223 exceeded the decline volume – institutions are accumulating. Funding rates remain positive — the main part of buyers are still in longs. Open interest didn’t show mass liquidations – strong hands are holding positions. The order book shows a supply wall at $118K and a vacuum to $120,000 above.
📈 Potential Bullish Scenario
Price above $116.2K + RSI > 70.
- Next checkpoint: break of $117.9K, with volume > 20K BTC/hour.
- Targets in ascending order: $118.3K → $118.8K → $120K.
- Invalidation: loss of $116,500 on volume.
📉 Potential Bearish Scenario
Loss of current range middle ($117K) + RSI break below 68.
- Confirmation: re-test $116.2K fails + volume > 25K BTC/hour.
- Target Cascade: $114.9K → $113,888 → $112,844.
- Complete Invalidation: breakout above $118.5K.
✅ Potential Entry $117.3K-$117.4K, between current price and EMA-20.
- Requirements: bullish pattern on 15M, RSI > 69, growing buying volumes.
🛑 Potential Stop $116.1K, below 0.236 Fibonacci.
- Activation: hourly close below the level + RSI < 65 + bearish engulfing.
Between the volatility and the volume spikes, now’s a great time to enter the WOW2025 Grand Prix – a mind-blowing $4.2 million — plus a Tesla Cybertruck rewards await.
What to Watch in the Coming Hours
In the coming hours, it’s critically important to observe price behavior in the $117-$117.8K range. Formation of a stable base above $117K while maintaining RSI above 70 will open the path to retesting the all-time high $118.3K. The ability to break and consolidate above this level will activate movement to the psychological mark of $120K. Conversely, loss of $116.8K support with subsequent test of $116.2K will signal the development of a second correction wave with targets of $114.9K and $113.8K.


