
XMR pulls back after a rapid rally – does the reversal from 320 signal the collapse of the uptrend? What should we expect after the recent rebound from $289, the move to $302, and the pullback to $293 all within a few days? Let’s try to make sense of this extremely high volatility.
Overall XMR Price Structure
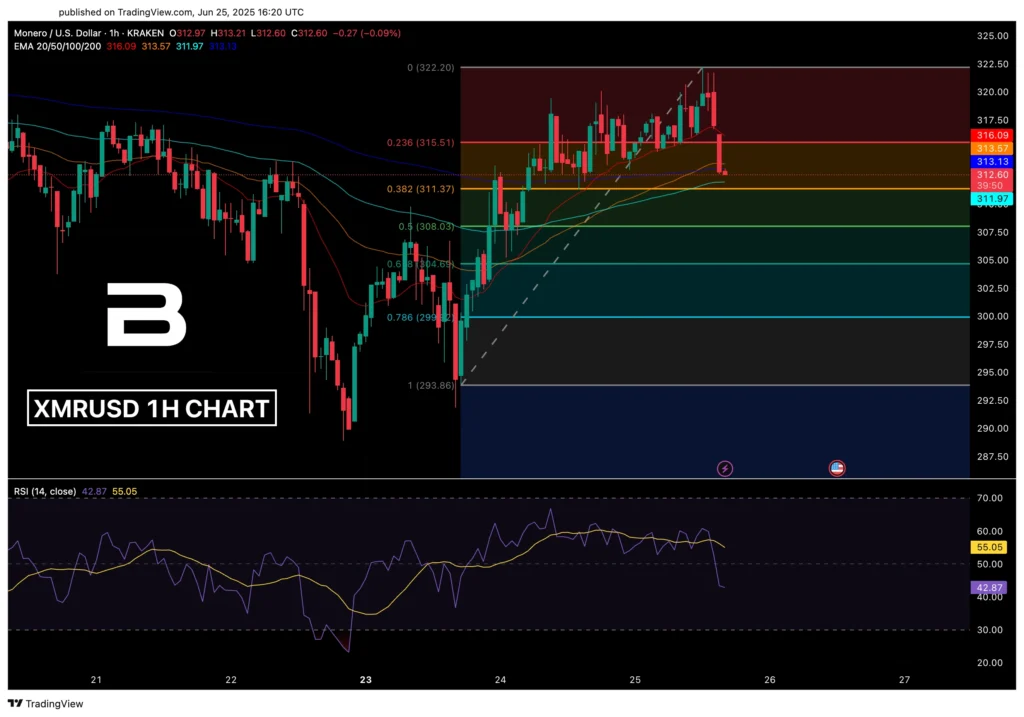
Since the reversal from $293.86, Monero has rapidly formed a stable HH/HL series. The $322.20 peak became an extremum, after which the market tested 0.236 three times and settled below this level. We are now seeing a sharp correction, and the $312.60 price is positioned between the EMA-50/200 cluster above and the EMA-100 below. Although the latest higher-low at $311.97 has not been breached. So the base of the up-structure is intact, losing the 0.382 Fibo would invert the short-term dynamic to bearish.
While XRM consolidates, thousands are gearing up for the WOW2025 competition on BloFin — where traders can win a Tesla and split $4.2M in rewards.
XMR EMA and RSI
- EMA-20 $316.09. The fastest-moving average is already sloping downward. Price is consistently below the line, confirming the short-term correction. A one-hour close above the EMA-20 with RSI ≥ 55 would be the first sign of renewed buyer initiative.
- EMA-50 $313.57. Forms the upper boundary of the mid-term cluster. While XMR trades below it, the short-term growth impulse can be considered lost. A repeated close above the level is needed to restore upward momentum.
- EMA-100 $311.97. The key support of the entire HH/HL structure. The price is holding slightly above it, and the angle remains positive. However, the first one-hour close below the line may indicate a de-facto break of the higher-lows series.
- EMA-200 $313.13. This level interestingly sits below the EMA-50, keeping the 50/200 “golden cross” active. Yet the level itself is now resistance. Two consecutive closes below the EMA-200 will reduce the cross’s significance to a minimum and strengthen bearish control.
RSI
The indicator has dropped below the neutral 50 axis and is approaching a critical 42.87. A sustained fall under 40 would confirm seller dominance, while a move back above 55 would require an impulsive volume surge and could then signal a reversal.
XMR Fibonacci Key Zones
- 0.236 ($315.51). The upper boundary of the current pullback; level almost coincides with the EMA-20. A one-hour close above the mark with an RSI ≥ 55 would provide the first confirmation of a short-term bullish recovery.
- 0.382 ($311.37). Critical support is located within $0.6 of the EMA-100 ($311.97). Holding the level is necessary to preserve the higher-lows series; the first one-hour close below will confirm a structural break and shift focus to a deeper correction.
- 0.5 ($308.03). The first extended target after losing the EMA-100. Reaching the mark absorbs 50 % of the prior impulse; price and volume reaction here will show whether the market can form a new reversal base.
- 0.618 ($304.68). Coinciding with the projection of the ascending trend line in the next few hours; holding the level on increased demand can serve as a base for a new higher-low.
- 0.786 ($299.52). The last technical frontier of the bullish impulse; a sustained close below will move the market into a full bearish scenario and open the path to a retest of $293.86.
Market Sentiment
The overall picture is shifting to moderately bearish. Loss of the EMA-20 and 0.236 is accompanied by RSI falling below the neutral axis, and the EMA-50/200 cluster transforms from support into resistance. While 0.382 holds, the market retains a chance for consolidation; a break will finally tilt the balance toward sellers.
📈 Potential Bullish Scenario
- Confirmation. First H1 close above $315.5 (0.236) and RSI ≥ 55
- Targets. $318.80 (local high on 24 June) → retest of $322.20
- Invalidation. First H1 closed below $313 after retesting 0.236
📉 Potential Bearish Scenario
- Confirmation. H1 close below $311.3 (0.382 + EMA-100) with RSI ≤ 42
- Targets. $308.0 (0.5) → $304.7 (0.618)
- Invalidation. Price returning above $315.5 on rising buying volume and RSI ≥ 55
✅ Potential Long Entry. Maybe reasonable while the $312–$313 zone (EMA-100 / 0.382) holds. Entry is appropriate on a pullback to the EMA-100 when:
- RSI stays above 50
- A candle prints a long lower wick or a bullish engulfing at $312.5–$313
- No high-volume bearish candles appear
✅ Potential Short Entry. Maybe reasonable while the price stays below $316.0 (0.236 + EMA-20). Entry is possible on a retest of $315.5–$316.1 when:
- RSI ≤ 50 and turns down
- A bearish candlestick pattern or a long upper wick forms
- Selling volume is moderate or rising
🛑 Potential Long Stop. Maybe reasonable below $308.0 (0.5 level) — beneath the last higher-low and under the EMA-50, if:
- The one-hour candle body closes below $308.0
- RSI drops below 45
- Selling volume increases and local HLs break consecutively
🛑 Potential Short Stop. Maybe reasonable above $318.8 is reasonable if:
- An H1 close prints above $318.8
- RSI rises above 55
- An impulsive bullish candle appears on high-volume
While XRM consolidates, thousands are gearing up for the WOW2025 competition on BloFin — where traders can win a Tesla and split $4.2M in rewards.
Conclusion
The key trigger remains price action in the 0.382 Fibo ($311.37) – EMA-100 ($311.97) zone. Holding above this dual support lets the market consolidate below 0.236, and recovery above the EMA-50/200 cluster returns the short-term bullish impulse. A break of $311.3 with RSI ≤ 42 activates the $308 and $304.7 targets; particular attention should be paid to volume reaction at the 0.5 and 0.618 levels.


