
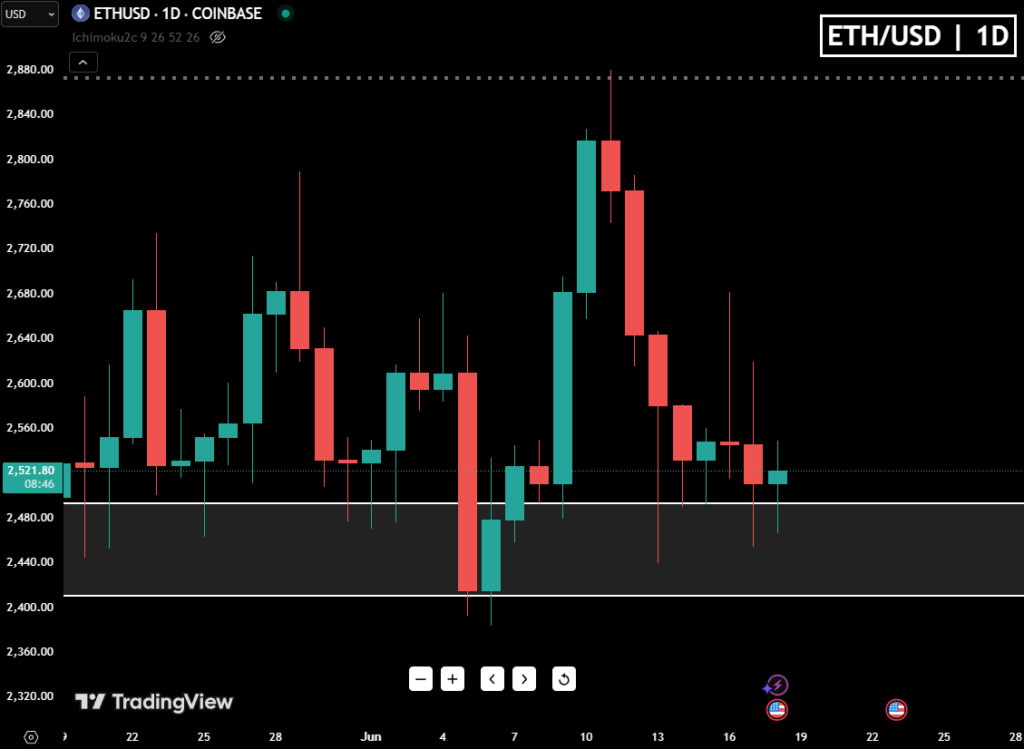
Ethereum is down by 16% since June 11. At that date, Ether failed to break above the $2,870 resistance zone. As buyers lost control, the leading altcoin plunged to as low as $2,439 – temporarily putting an end to hopes of a new breakthrough.
But that’s not the whole story, now… is it?
This selloff is hardly Ethereum’s fault, after all, since last week we’ve been living in one of the most uncertain times in crypto this year. The potential ramifications of the Israel-Iran conflict — plus the chance of having the U.S. army join the battle, led investors across all financial markets to sprint away from risky markets.
In fact, we are living through it right now. While it makes price action setups a tad more challenging to read, Ethereum is still holding above $2,500, showing signs of consolidation. Furthermore, the current support zone where Ether is right now has proven to be a major accumulation spot — fueling chances of a new short-term bullish trend.
As macroeconomics goes, we still haven’t seen major spikes in areas like oil prices or other key inflationary drivers. The Fed announced today that the current interest rate will go unchanged until July 30, as Powell is still assessing the inflationary pressures the U.S. is or will be under in a couple of months.
So while geopolitical tensions remain unresolved, traders still have to navigate the charts, and Ethereum’s current zone may offer a clue.
Ether in Accumulation Phase
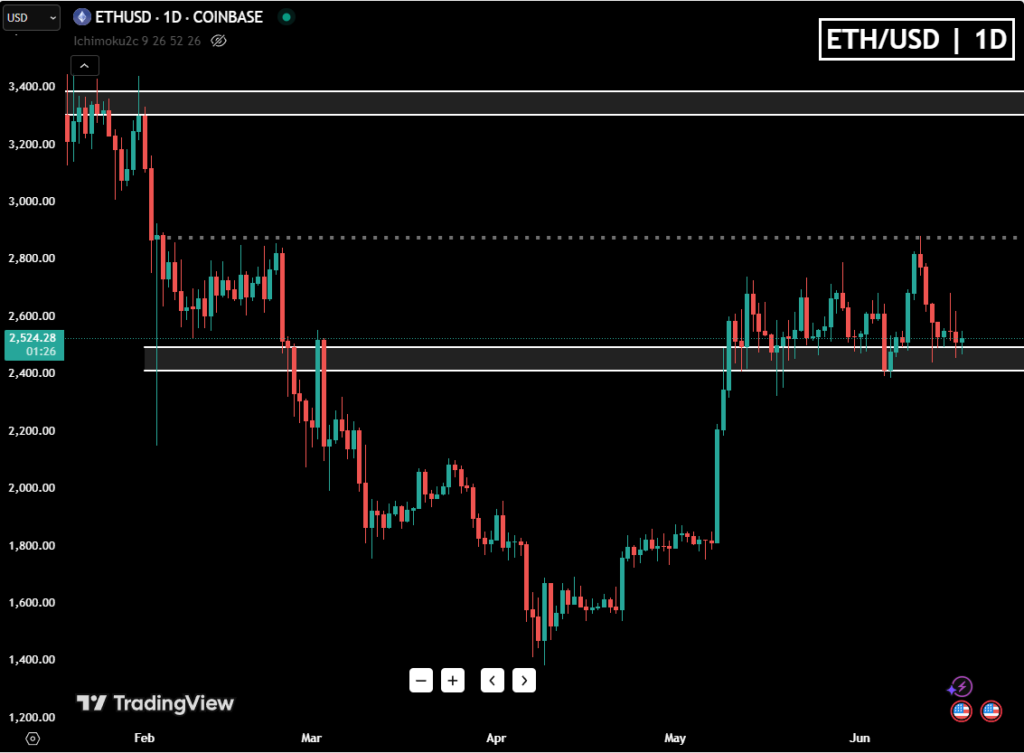
At the 1-day chart, the support just below $2,500 has proven a major accumulation zone. For instance, last year Ether ranged in that zone for the majority of October before ultimately skyrocketing past $3,300 by November.
Point being: the fact that despite major selling pressure, Ether still held on to the $2,500 level may tell us that buyers are picking themselves up to another go. So let’s look at some indicators.
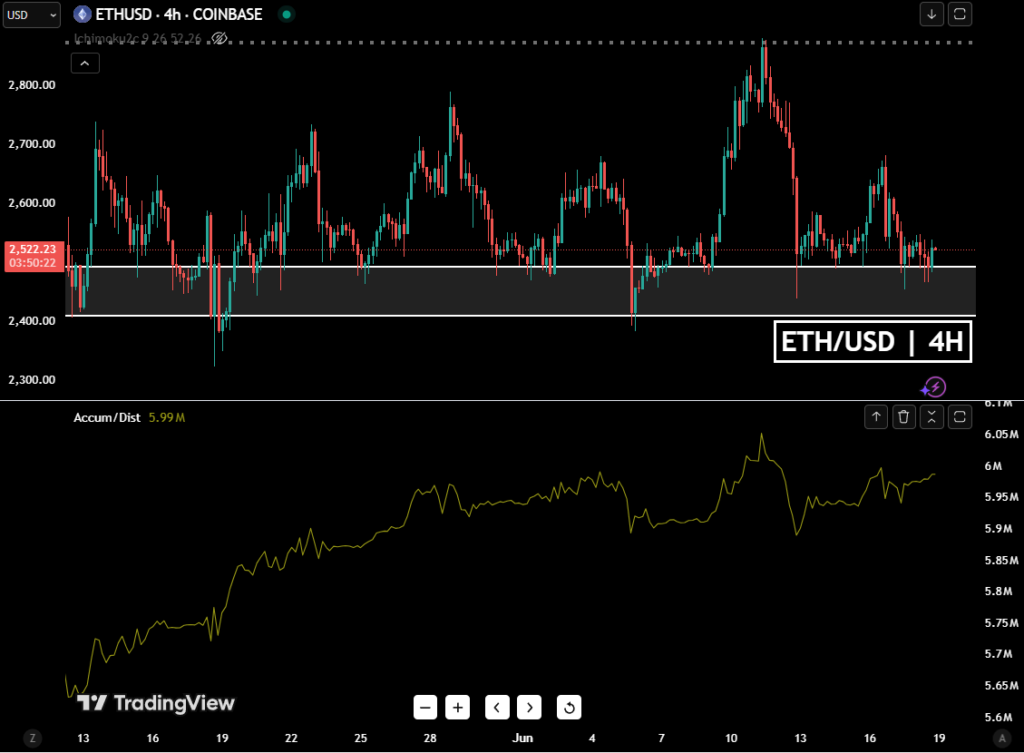
Accumulation/Distribution
As we can see by the A/D lines corroborate this idea as it tends to spike once the asset reaches that zone.
RSI
The relative strength index also indicates potential bullish momentum. As Ether went down on June 11, it entered the accumulation stage, later prompting another try at above $2,600.
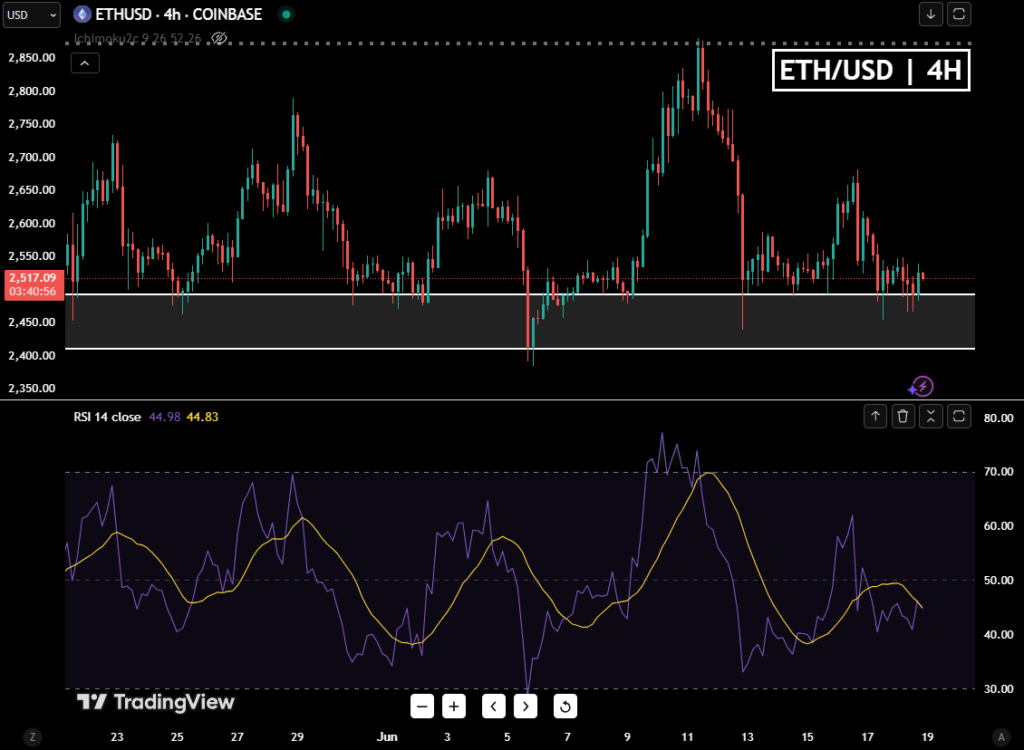
Now, as it has once again ranged at the $2,500 zone, RSI could be showing early signs that price is ready to move upward once again.
MACD
On the 4-hour chart, MACD’s bearish histogram appears to be fading as moving averages tighten, potentially resulting in a bullish crossover. This cross has already happened in faster timeframes like the 1-hour chart.
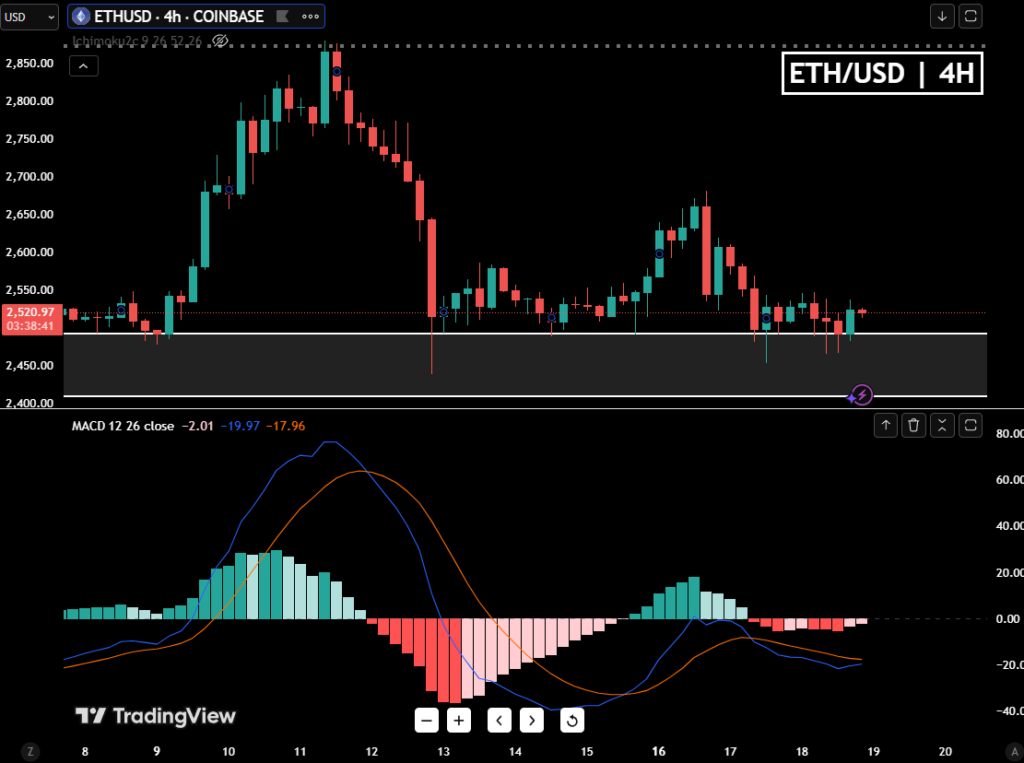
By the looks of it, buyers could be gearing up even despite all the uncertainty revolving around the market. As of right now, traders should watch volume closely, as sudden bullish spikes could indicate another go above.
Make-or-Break Moment
As Ethereum continues to range in a channel, the first target should be the $2,600 zone, as this level has acted as a short-term resistance in previous attempts. A successful break above $2,600 could open the door for a retest of $2,770, a key level that previously rejected bullish momentum.
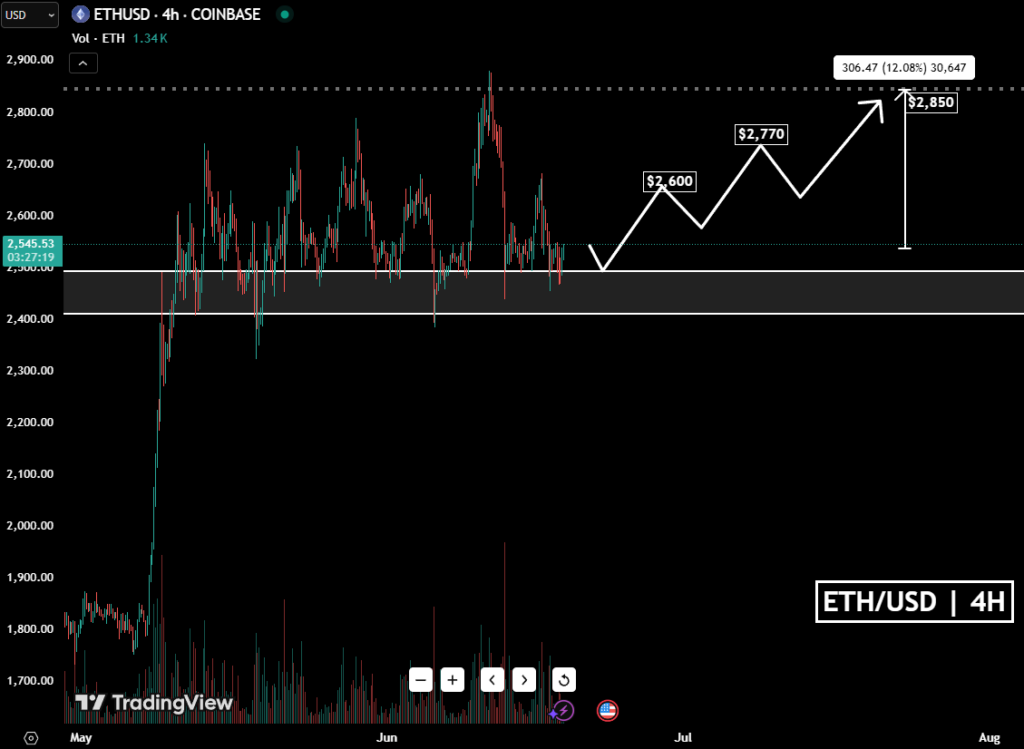
However, given the crazy times we’re going through. A good ‘out’ of the position would be at $2,380 as it represents a critical support level that has historically acted as a safety net during previous downturns.
WEEX is currently running one of the strongest welcome offers out there: 20% deposit bonus & Up to $30K in trading rewards. If you’re going to trade anyway, why not get rewarded like this?


