
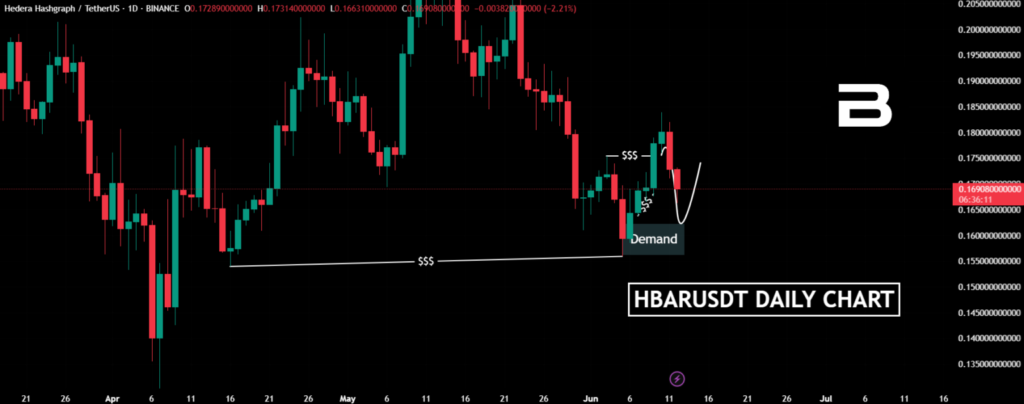
- HBAR just swept daily liquidity, reacting to a marked demand zone
- Fractal behavior on H2 shows similar structure, with possible upside targets
- Scenarios are not guaranteed — price may still move unpredictably, so adaptability is key
If you’ve been following these breakdowns, you already know we don’t just throw charts around.
We read price with intention — and if you remember our previous HBAR piece, we pointed to a possible bullish reaction from a demand zone. That played out partly, but there was something lurking on the daily timeframe that we couldn’t ignore: liquidity.
Let’s take a moment and break that down for anyone new — liquidity is basically where money is sitting in the market, often in the form of stop losses. The market loves grabbing it before making its real move.
That’s why we often see sudden spikes above or below key levels — not by accident, but because that’s where the juice is.
And yes, HBAR just did exactly that.
Zooming Out: The Daily Timeframe
Looking at the daily chart, we can see the price was sitting on a clean demand level. But just under that, there were equal lows — classic liquidity. I’d bet some of you were long too early, right where most had their stops.
Now that the price has swept that liquidity, what comes next? That’s where things get interesting.
Zooming In: The H2 Fractal Setup
Let’s move to the H2 timeframe — and here’s where it gets juicy. You’ve probably heard the term “the market is fractal.” What does that even mean?
Simply put, price action patterns repeat themselves on different timeframes. What you see on the daily, you can also spot on the hourly — just at different scales. It’s like zooming in on a spiral and seeing the same structure over and over.
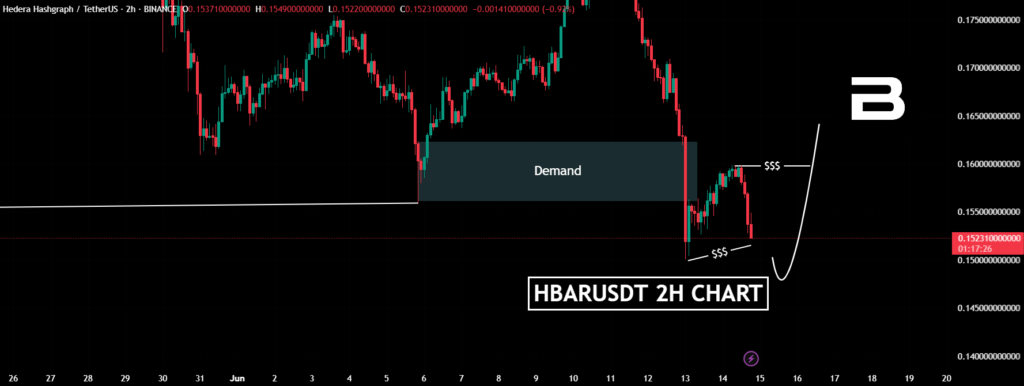
In this case, the H2 chart is mimicking the daily: we’ve got two clear lows forming just like before. And again, right below them is likely a cluster of stop losses — liquidity waiting to be taken.
If HBAR sweeps those lows, that could trigger the move to the upside. There’s a clean high sitting just above — and if the price reacts as expected, it might go hunting for that next.
HBAR Price Prediction: What’s Likely Next?
In this scenario, my hbar PRICE prediction is fairly binary — and yeah, that’s how real trading works sometimes.
- Bullish scenario: A sweep of those H2 lows, followed by a sharp bounce targeting the last local high.
- Bearish scenario: If the sweep doesn’t create a reaction or we lose that demand structure, HBAR could bleed lower, and we’d need to reassess the next clean zone.
Again — nothing is 100% certain. Anyone promising that is either selling dreams or hasn’t traded real money. Markets are messy, reactive, and sometimes completely irrational.
The best we can do is prepare scenarios based on structure, liquidity, and reactions — not predictions set in stone.
Final Thoughts
HBAR is at a critical point, no doubt. The liquidity games we saw play out on the daily are now reflecting on the H2 — textbook fractal behavior. If you’ve ever traded around these patterns, you know how powerful these setups can be.
But like always, stay nimble. Be the trader who listens to the market, not the one who argues with it.
Ready to trade? Join WEEX via Bitcoinsensus and get a 20% deposit bonus — with up to 400 USDT waiting for you. Claim your share of the 30,000 USDT reward pool.


