Can Dogecoin Break Through? Double Bottom Pattern Faces MACD Slowdown
By Giovane
Dogecoin has picked up some momentum over the last 24 hours. The memecoin, which saw a steep decline a couple of days ago, reached a peak of $0.2367 throughout the day, reigniting hopes of a new bullish trend.
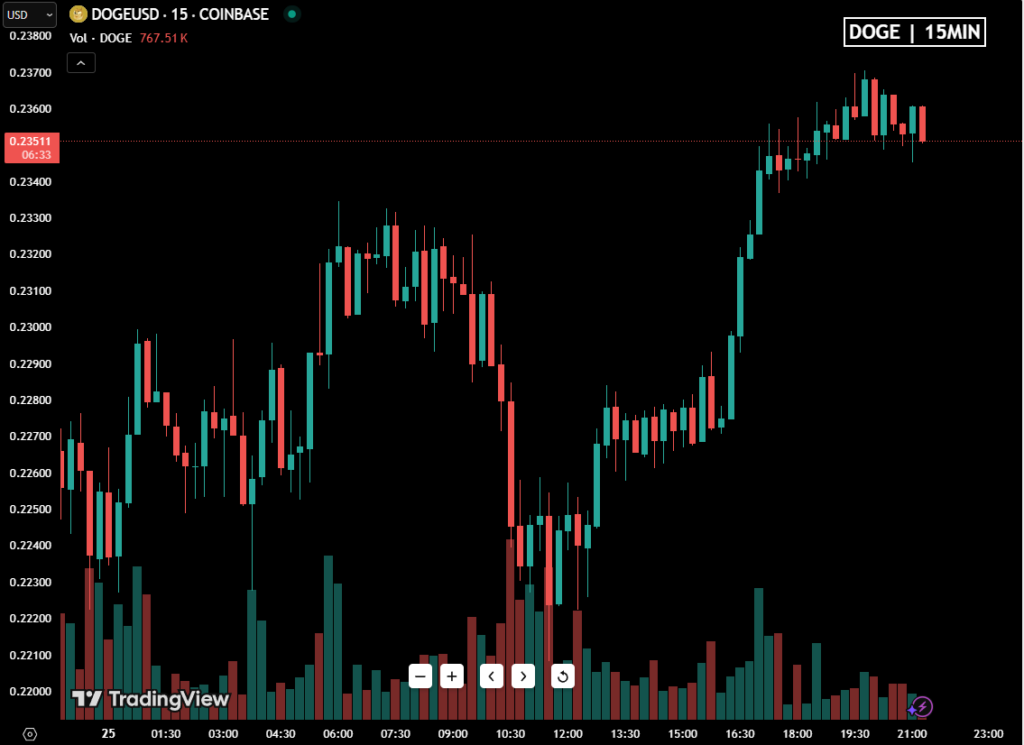
The short-term scenario for Doge isn’t looking great, but higher timeframes may reveal an entirely different picture.
Dogecoin is down by 18% since its July 21st high of $0.2887. This retraction erased all gains seen throughout the week, with $DOGE now closing at a close-to-breakeven 1.86% decrease over the last seven days.
In the past 4 days, the memecoin saw a heavy influx of selling pressure, with trading volume averaging around $600 million per day, contributing to Dogecoin’s intra-week decline.
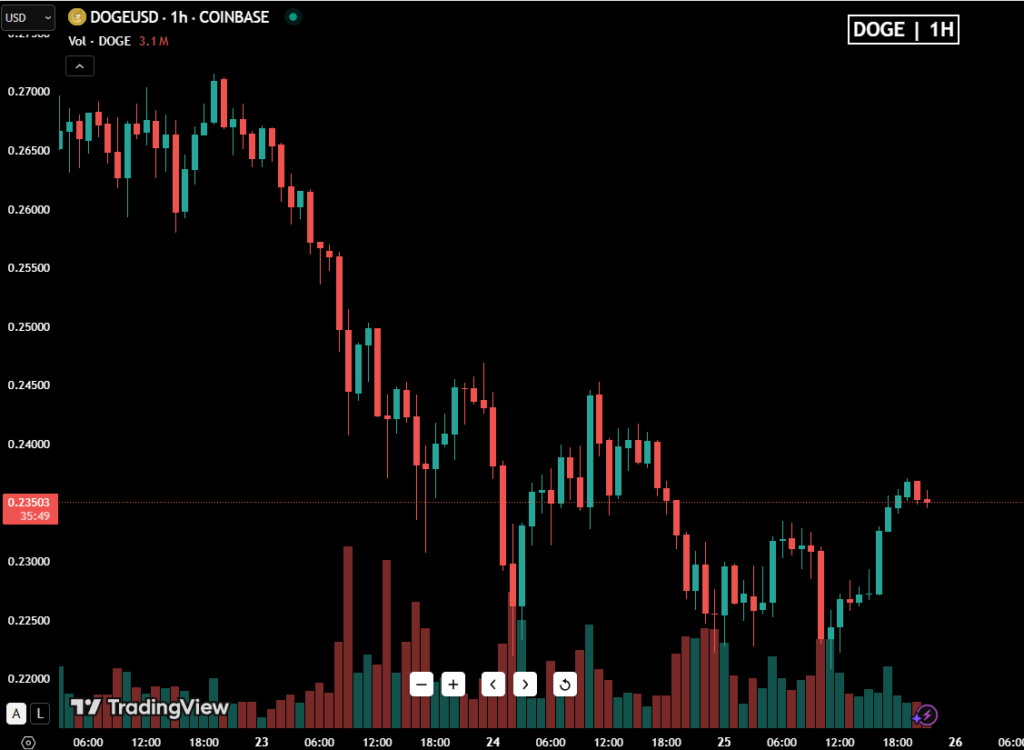
However, watching the price from a larger scope reveals a more favorable scenario for $DOGE. Over the past 30 days, the asset gained over 40% in value, going from around $0.16 to the current $0.2367 price.
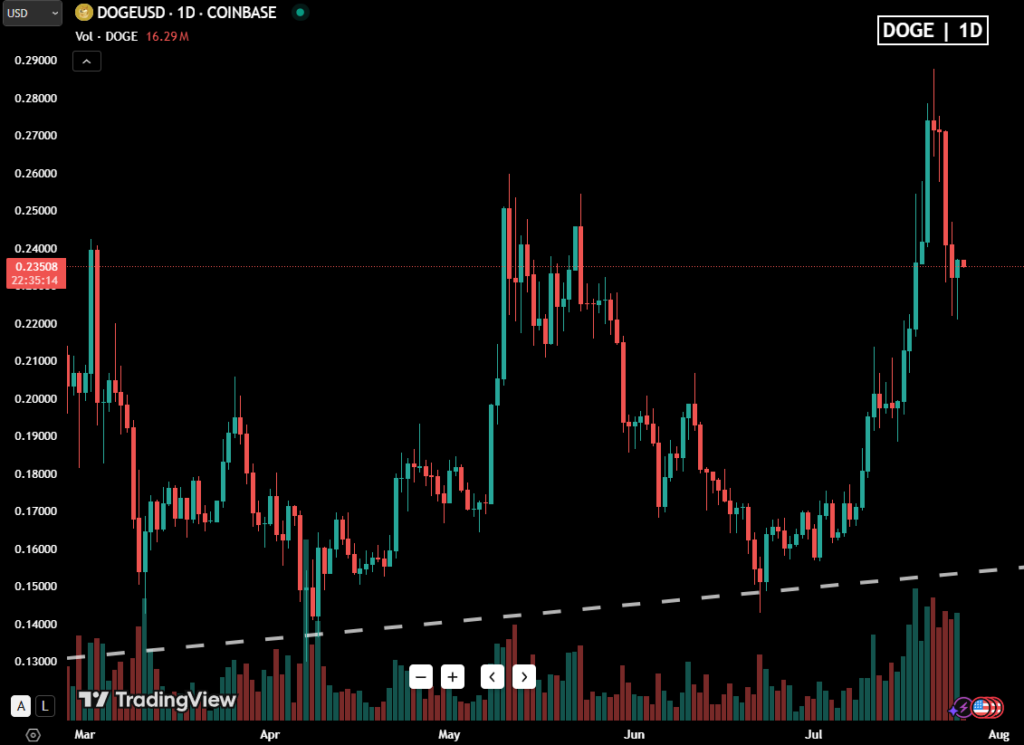
Doge’s Double Bottom
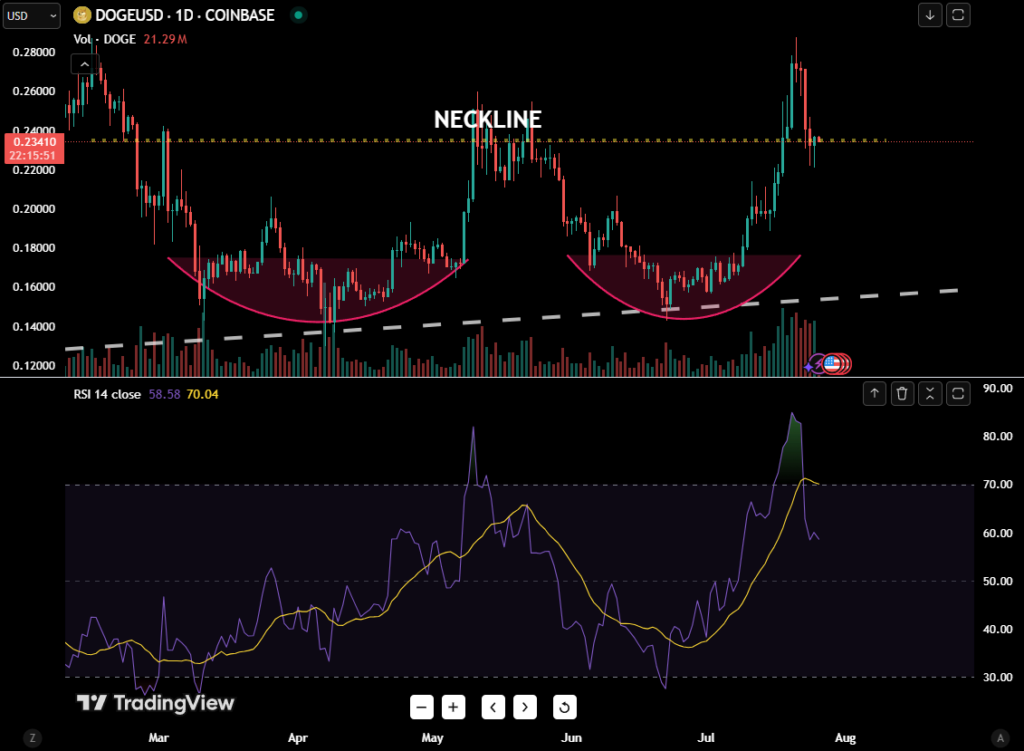
A couple of days ago, we talked about how Dogecoin formed a “double bottom” pattern, potentially setting up the memecoin for a strong bullish trend. And despite the significant price drop since then, this potential setup still makes sense given that selling pressure got rejected around the “double bottom’s” neckline resistance.
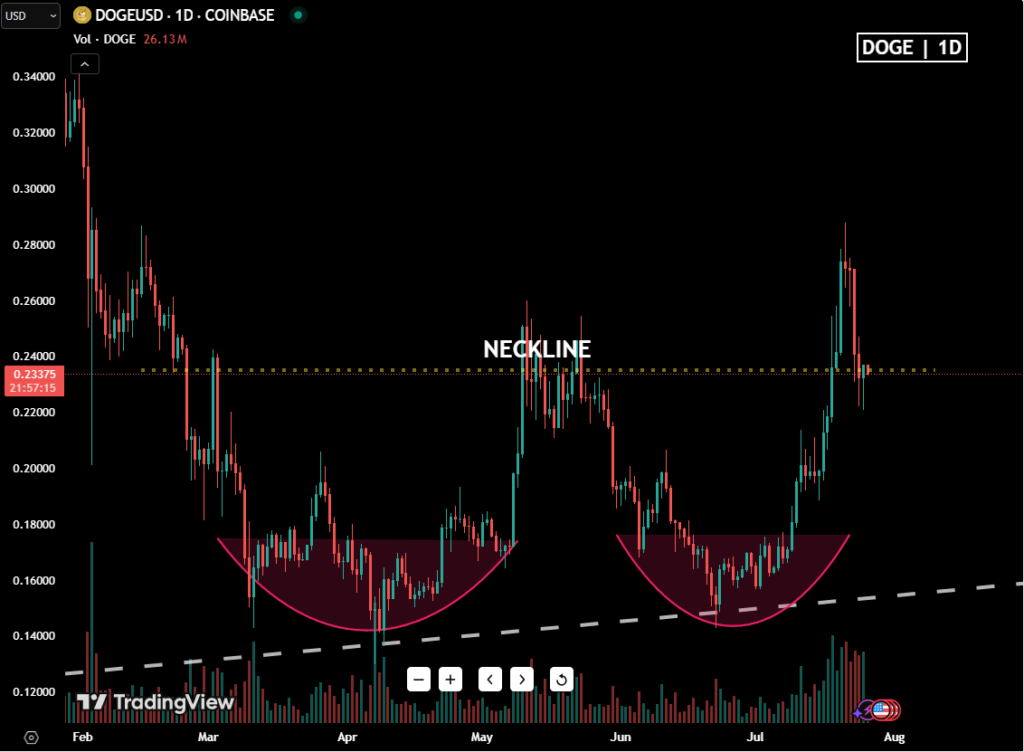
The neckline around the $0.23–$0.24 range remains a key battleground. A clean move above this level, backed by rising volume, might confirm the double bottom and ignite a fresh rally targeting the previous high of $0.2887, or even beyond if sentiment strengthens.
Last week, we also talked about how the RSI indicator was pointing to DOGE being “overbought”. Now, 4 days later, the indicator is now far below at 56 points, suggesting that bullish momentum could be possible in the future.
With that said, the MACD is now showing that bullish momentum could be fading. While the double bottom setup and RSI reset present bullish possibilities, the MACD is throwing a hint of hesitation into the mix.
The MACD line is descending from above the signal line, and the histogram bars are contracting, which could either reflect on the neckline-zone accumulation, or plain exhaustion from buyers.
This behavior is common near key breakout zones, where momentum slows as market participants weigh next steps.
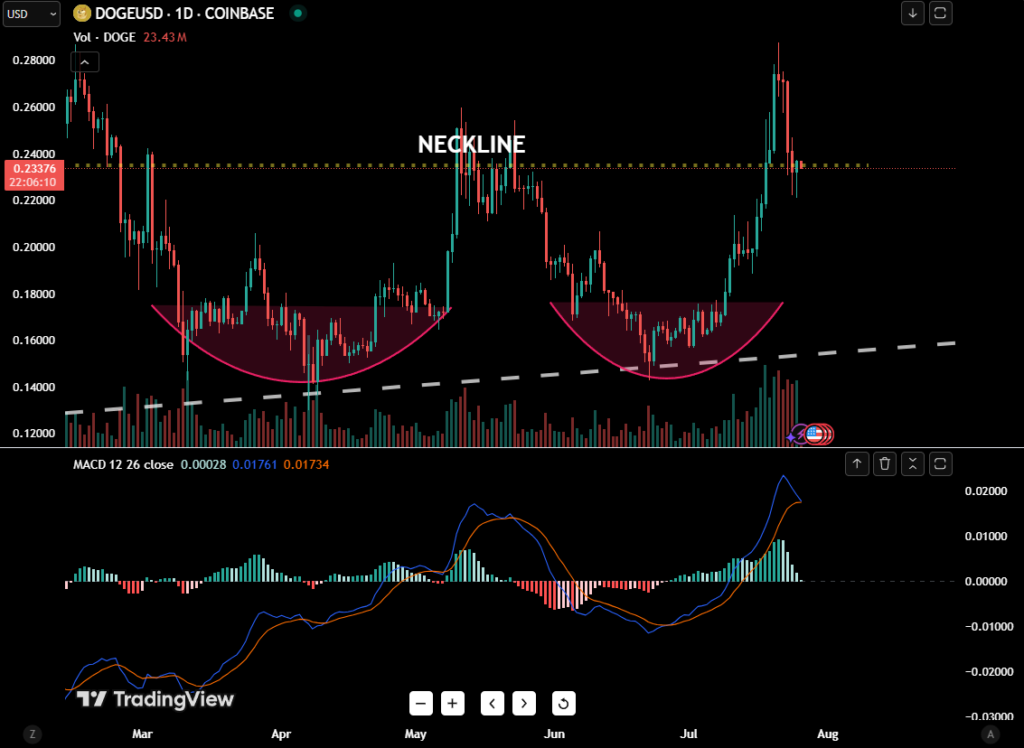
Despite signs of fatigue, the bigger picture still offers hope. Accumulation near the neckline often precedes a breakout, especially when the pullback is shallow and volume doesn’t collapse entirely.
So while technical analysis and other indicators may point to an upward trend, uncertainty is still revolving in the market.
Key Levels to Watch
Nearest Support Zones
- $0.21–$0.22: Closest active support, recently held during minor pullbacks.
- $0.195: Deeper support tied to prior consolidation range.
- $0.16: Historical base from which the latest rally originated.
Nearest Resistance Zones
- $0.23–$0.24: Neckline of the double bottom and current zone of price congestion.
- $0.2887: Last swing high — key test for bullish continuation.
- $0.30+: Psychological resistance; round number and former rally cap.
Key Things to Know
- Price is currently coiling under major resistance.
- MACD is showing weakening bullish momentum, not a full reversal yet.
- RSI is cooled off at 56 — suggests upside potential remains.
- Volume trends will likely dictate whether this stalls or rips higher.
Want your trades to actually mean something this month? Join the WWFC challenge and trade your way into the top. We’ve already got the team set up — all you need to do is register, trade and go for a piece of the $900K prize pool.
