
Dogecoin is outperforming all top-10 cryptocurrencies by market cap, boasting a strong 12% increase in value over the last 24 hours. The world’s first memecoin is now reverting to May price levels, as institutional demand could reinforce DOGE’s position as an asset.
Current Market Snapshot
$DOGE is currently trading at $0.2340, down from a daily high of $0.2551. The memecoin is also showcasing a strong performance on longer timeframes, up by 17% in the week, and a whopping 38% increase over the last 30 days.
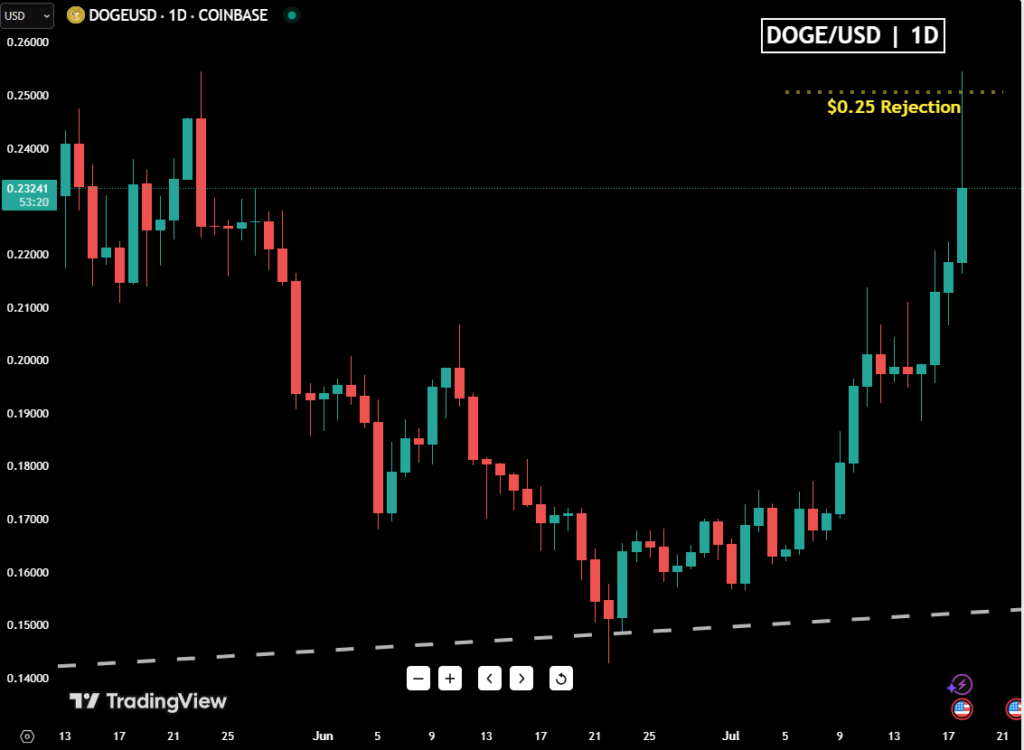
Today marked the first time $DOGE attempted to reach above $0.25 in four months. While this breakout was unsuccessful, the memecoin’s strong upward momentum hints that buyers may continue to pressure that zone in the coming days.
Surge in Whale Activity
Data from Tokenview reveals a surge in large transactions on the Dogecoin network. Transactions involving large sums of Dogecoin peaked on July 17, marking the highest number of transactions in the last 2 months.
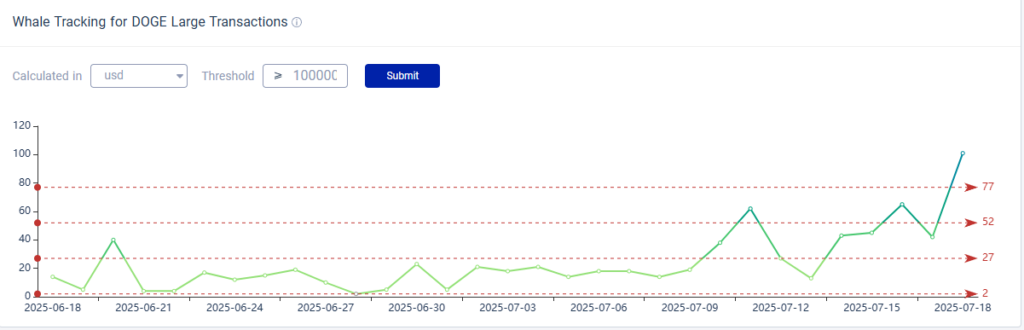
Overall, whale movements have increased by 83% over the past day, signaling heightened network activity that could reflect either accumulation, distribution, or large-scale repositioning.
What’s Fueling The Surge
Nasdaq-listed firm, “Bit Origin”, officially announced a massive $500 million Dogecoin treasury, marking one of the most significant moves for institutional adoption in the memecoin market. Also, Bit Origin will become the first publicly traded company to back Dogecoin, or any other memecoin for that matter, as a core balance sheet asset.
You can read the full story about this development here, but either way, the half-billion investment into Dogecoin as an asset fueled investor sentiment, leading to one of the strongest rallies of the year.
What’s Next?
Today’s strong daily candle is slowly retracting as this article is being written, while the 1-hour chart already shows signs that buyers and sellers could settle at $0.235 as a resistance zone. A 1-hour candle that went below $0.230 got instantly rejected by bulls, signaling that the current zone is likely where price will accumulate next.
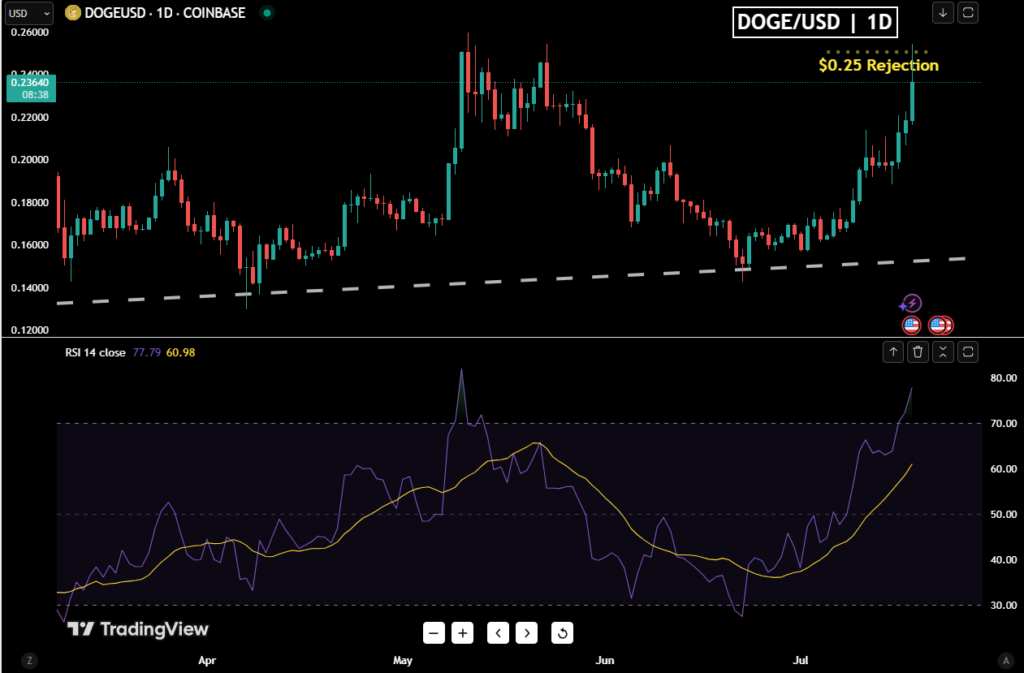
So let’s assert Dogecoin’s momentum. The Relative Strength Index (RSI) technical indicator is currently at 77 points on a daily timeframe, above the 70-point threshold, meaning that price is currently at “overbought” levels.
Meanwhile, the Moving Average Convergence Divergence (MACD) tool confirms bullish momentum. The MACD line has already crossed above the signal line, and the histogram is expanding, a technical setup that typically signals strength building behind the move.
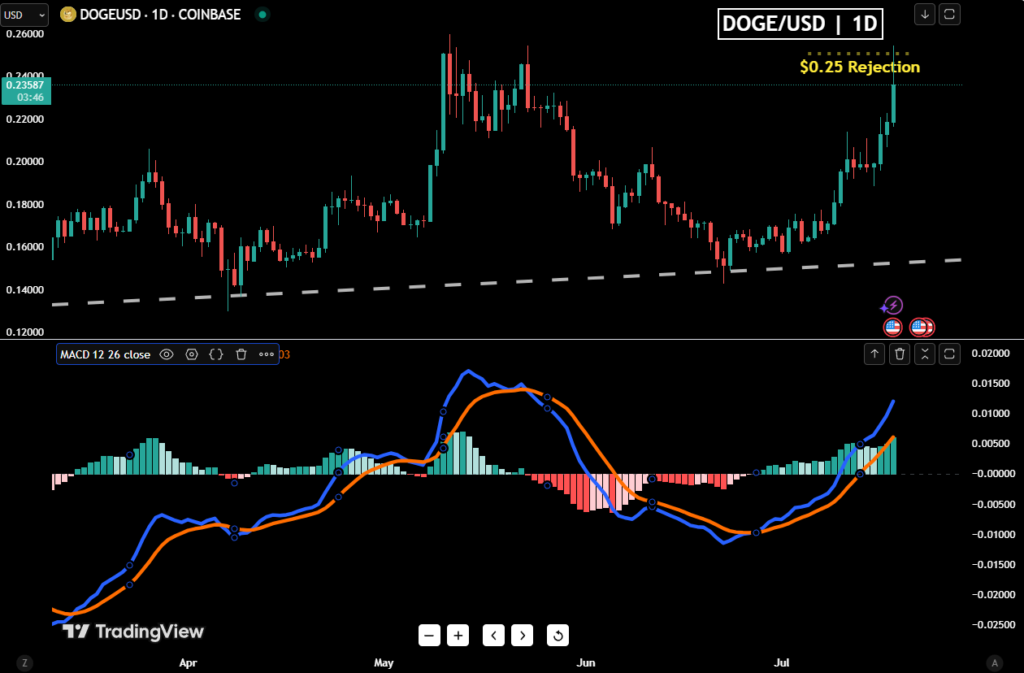
With both price action and momentum indicators aligned, the current breakout attempt appears to be backed by trend continuation rather than early exhaustion.
What to Look For
- Recent Performance: Dogecoin is up 12% over the last 24 hours, 17% on the week, and 38% in the past 30 days — the strongest rally in months.
- Breakout Zone: The $0.25 level remains the key resistance. Buyers have tested it, but haven’t cleared it with volume — yet.
- MACD Momentum: Technicals confirm a bullish crossover. Histogram is expanding, signaling continuation rather than reversal.
- RSI Caution: Daily RSI sits at 77, above the 70 “overbought” threshold. Momentum is strong, but a short-term cooldown wouldn’t be unusual.
Want your trades to actually mean something this month? Join the WWFC challenge and trade your way to the top. We’ve already got the team set up — all you need to do is register, trade and go for a piece of the $900K prize pool.


