
HBAR at $0.267: bulls defend key support after 31% rally with RSI cooling from overbought levels and 0.618 Fibo at $0.25650 as critical support. Whether the correction is completing at current levels for growth resumption, or a test of deeper supports near EMA-50 ($0.24812) lies ahead.
Overall HBAR Price Structure
We observed an extremely powerful impulse movement from July 17 from the $0.23005 level that completed at $0.30324 after 18 hours. Buyers organized a breakout of the $0.244 resistance with a 3.2x increase in volumes relative to average.
At the top, three bearish candles formed with long upper wicks, indicating active position dumping. However, such a rapid impulse triggered a 38.2% correction of the entire impulse.
Currently, HBAR is between the 0.5 Fibo ($0.26466) and 0.382 Fibo ($0.27282) levels. The HH/HL structure is maintained: last significant low at $0.23005, last high at $0.30324. Structure violation will occur only on a drop below $0.23005.
Want to trade like a VIP from day one? Get up to $30,000 in welcome perks right now. This welcome deal from WEEX gives you more than just a bonus — it gives you a serious head start.
HBAR EMA and RSI
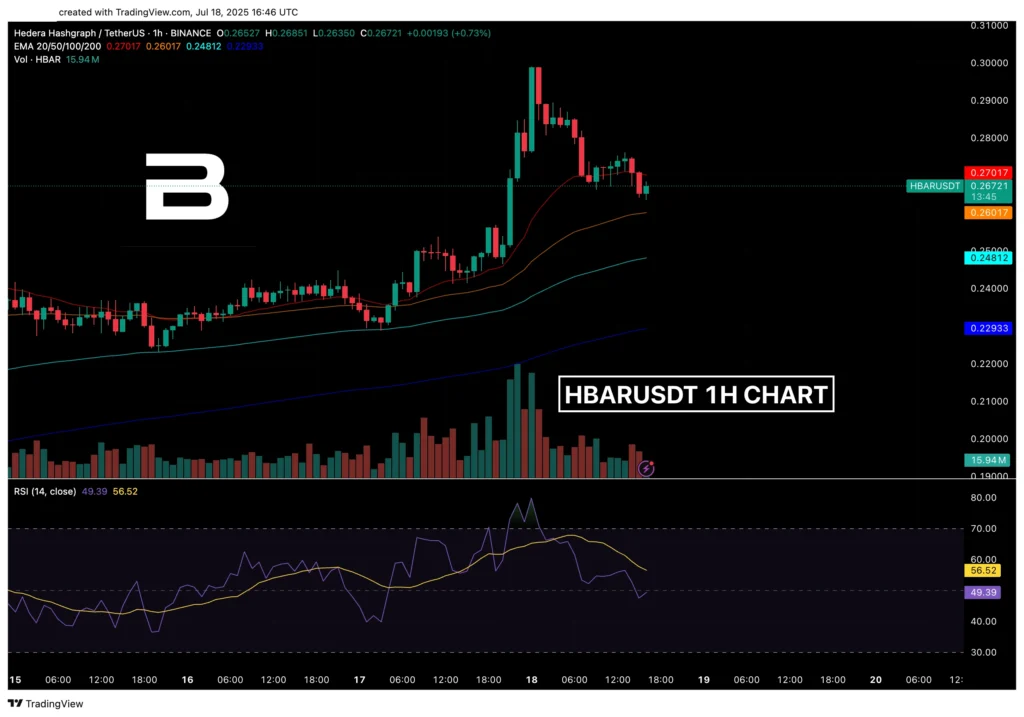
- EMA-20 ($0.27017). Slope angle +67°, reflecting the momentum of the previous impulse. The break and consolidation above may open movement to $0.282, where a cluster of limit sell orders is located. A drop below EMA-20 is now putting pressure on EMA-50.
- EMA-50 ($0.24812). Slope angle +42°, still confirming the medium-term uptrend. However, the consolidation below will change the medium-term structure to a descending trend with a target of $0.235.
- EMA-100 ($0.22933). Angle +28° and now serves as the boundary between correction and trend reversal. Testing this level will mean a 43.5% pullback from the impulse.
- EMA-200. Currently significantly below the current price, however, in case of a breach, we can consider a complete breakdown of the uptrend and transition to a deep correction.
HBAR RSI
We saw a peak value of 82.4 – the maximum for the last 30 days of trading, signaling clear overheating. However, now the value has noticeably decreased, and the current 52.4 is in the neutral zone, without signs of oversold.
RSI rising above 62 with price growth above EMA-20 may signal resumption of upward momentum. However, a drop below 48 may indicate seller dominance.
HBAR Fibonacci Key Zones
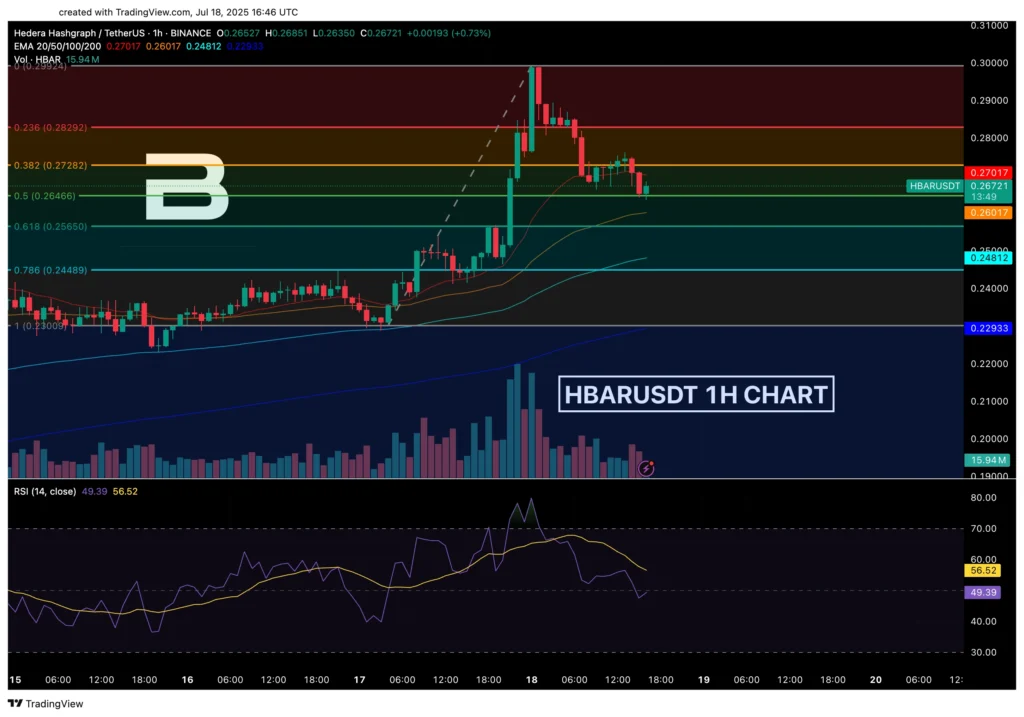
- 0.236 ($0.28292). Nearest resistance after EMA-20 breakout. Coincides with the horizontal level of previous consolidation on July 16. Consolidation above will open the path to $0.295.
- 0.382 ($0.27282). Current resistance, 2.2% above market. On an upward breakout, the target will be gap filling to 0.236. Downward rejection will lead to a 0.5 Fibo test.
- 0.5 ($0.26466). Active support, tested twice in the last 4 hours. Downward breach with volume 50% above the hourly average activates a bearish scenario to 0.618.
- 0.618 ($0.25650). Critical level for maintaining the upward structure. Located 3.9% below the current price. The drop below will change the short-term trend to descending with the EMA-50 target.
- 0.786 ($0.24489). Deep correction, 8.3% below market. Coincides with the EMA-50 zone, reinforcing support. Reaching means a 41% pullback from the impulse.
HBAR Market Sentiment
Currently, we observe a struggle between profit-taking after 31% growth and attempts to resume upward movement. RSI in neutral zone 56.52 gives no advantage to either bulls or bears. Volumes on correction decreased by 64% relative to impulse growth, indicating the absence of panic selling. The key factor will be the reaction at the 0.5 Fibo level in the next 2-4 hours.
📈 Potential Bullish Scenario
- Сonditions. Close above $0.27282 (0.382 Fibo) with RSI > 61 and volume above 15M USDT per hour.
- First target. $0.28292 (0.236 Fibo), where resistance from pending orders is expected.
- Second target. Retest of $0.30 with potential for breakout to $0.315. Confirmation will be the formation of a higher low above $0.266. Cancellation. Drop below $0.26466 with consolidation on two hourly candles.
📉 Potential Bearish Scenario
- Activation Conditions. Breach of $0.26466 (0.5 Fibo) with RSI < 52 and an increase in sell volume above 12M USDT per hour.
- First target. $0.25650 (0.618 Fibo), where bounce is possible.
- Second target. $0.24812 (EMA-50), meaning 31.7% correction. On EMA-50 breach, the next target is $0.235.
- Cancellation. Return above $0.272 with volume.
✅ Potential Entry
$0.26721 – current level between 0.5 and 0.382 Fibo.
- Confirmation. Completion of the first correction wave, RSI exited overbought but hasn’t reached oversold.
- Conditions. Formation of bullish candle formation, with RSI reversal above 55.
🛑 Potential Stop
$0.25550 – $0.001 below critical 0.618 Fibo level.
- Confirmation. Breach of this level should violate short-term upward structure and activate a cascade of long stop-losses.
- Conditions. Candles close below $0.25650, RSI drops below 48, and declining volume exceeds hourly average by 70%.
Want to trade like a VIP from day one? Get up to $30,000 in welcome perks right now. This welcome deal from WEEX gives you more than just a bonus — it gives you a serious head start.
What to Watch in the Coming Hours for HBAR
HBAR is testing the key support zone $0.266-0.267 after a 31% impulse growth. In the coming hours, the reaction at the 0.5 Fibo level ($0.26466) is critically important – holding above with RSI reversal will provide a base for growth resumption to $0.283-0.30. Support breach may lead to a deepening correction to EMA-50 ($0.24812). We monitor volume dynamics and RSI behavior relative to the 55 level.


