
Ever found yourself wondering why price reversed exactly there?
You’re not alone. In nearly all my price predictions, I talk about demand, supply, and liquidity — but what are these zones more precisely? If you’re serious about learning how the markets really move — and not just what your indicators tell you — then buckle up.
Let’s break it down using real price action, especially from the Bitcoin charts. Because that’s where all the magic (or manipulation) happens.
What Are Demand and Supply Zones in Trading?
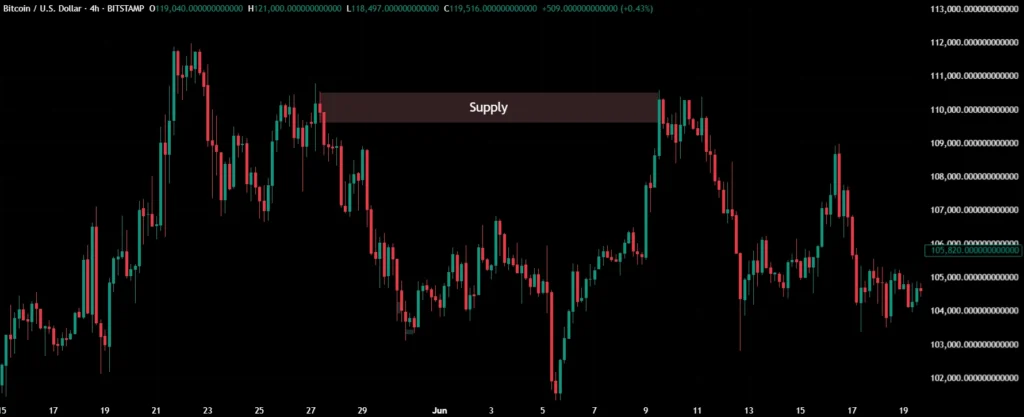
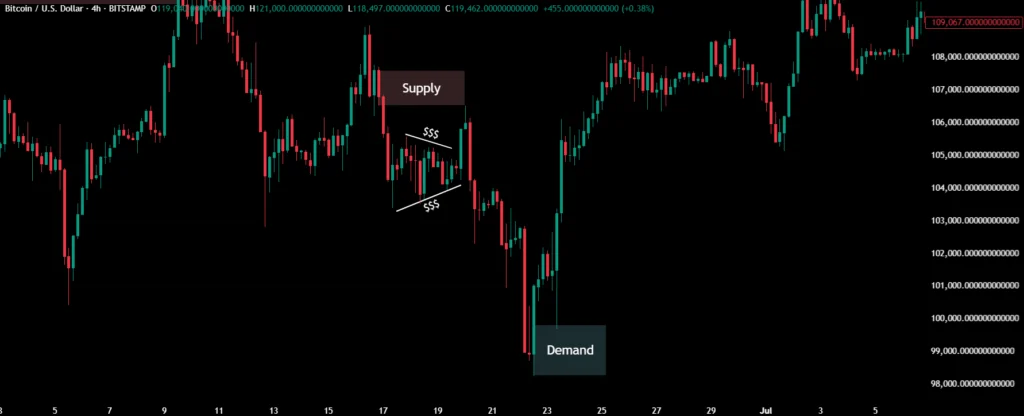
A demand zone is a price area where buyers aggressively entered the market, pushing the price up rapidly. Same for supply zones, but with sellers.
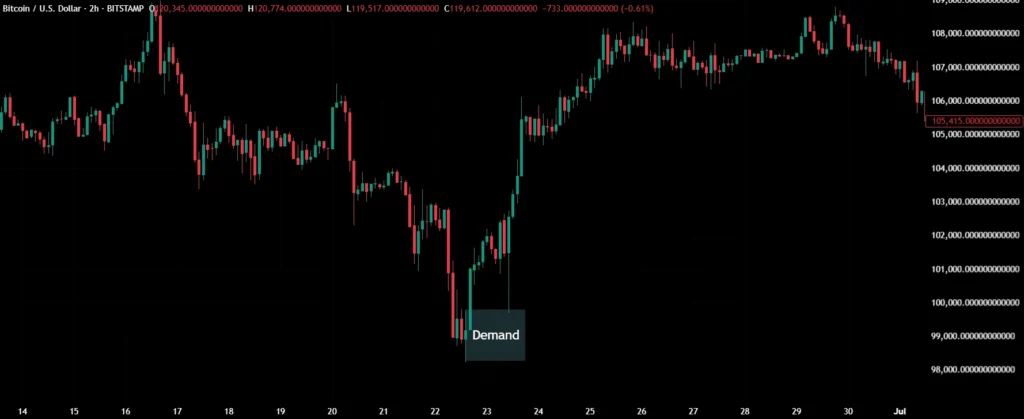
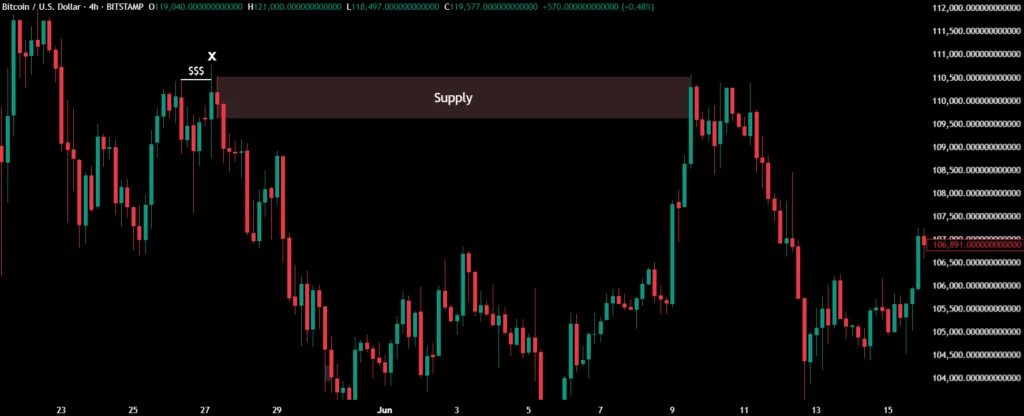
These zones often leave behind something called an imbalance — basically a part of the chart where there were way more buyers than sellers, or vice versa.
Now, not all demand or supply zones are created equal.
They exist across all timeframes — from weekly to the 1-minute chart. Higher timeframe zones are usually stronger, but if you’re a sniper (like me), you might want to go digging inside those areas to find refined demand zones on lower timeframes.
Why? Better risk-to-reward and tighter stops — and let’s be honest, who doesn’t want that?
💡How do I draw accurate supply and demand zones? Find the origin of a fast move. Check for imbalance. Confirm a liquidity sweep. Mark it.
How to Identify Demand Zones and Spot Institutional Intentions
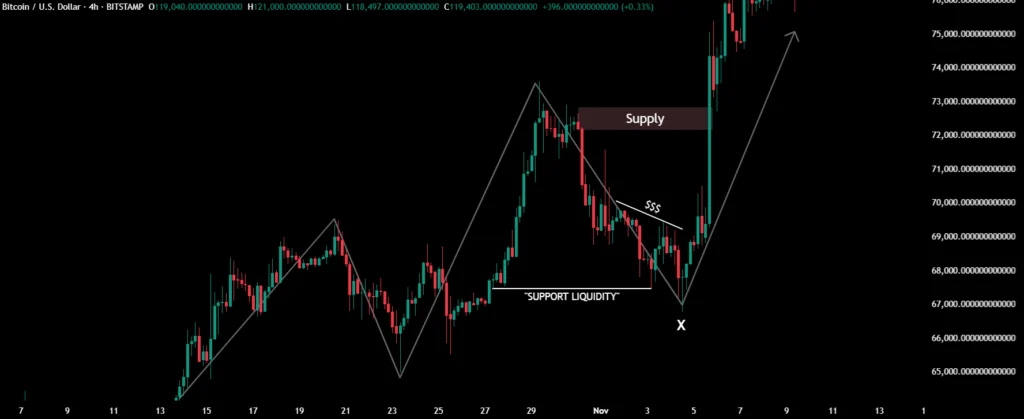
Here’s the kicker. The best zones? The ones that took liquidity before they moved.
Let’s pause there. Liquidity isn’t just some buzzword — it’s the fuel of the market. Big players don’t enter randomly. They need counterparties. If they want to buy big, they need someone to sell. Enter the concept of liquidity zones in crypto trading.
💡What indicators help confirm liquidity zones? Volume spikes, fair value gaps, divergence can help — but price action is king.
What counts as liquidity?
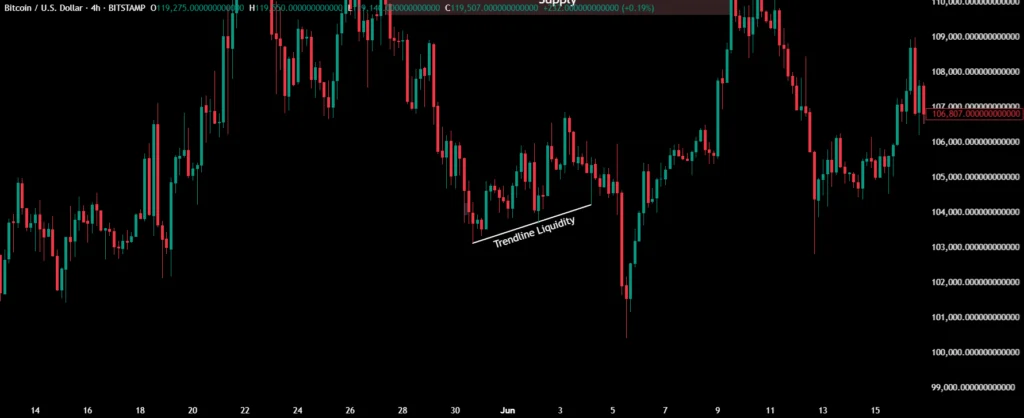
- Trendline liquidity — you know those clean upward trendlines retail loves? Smart money eats those alive.
- Horizontal support/resistance with multiple touches? That’s prime trap territory.
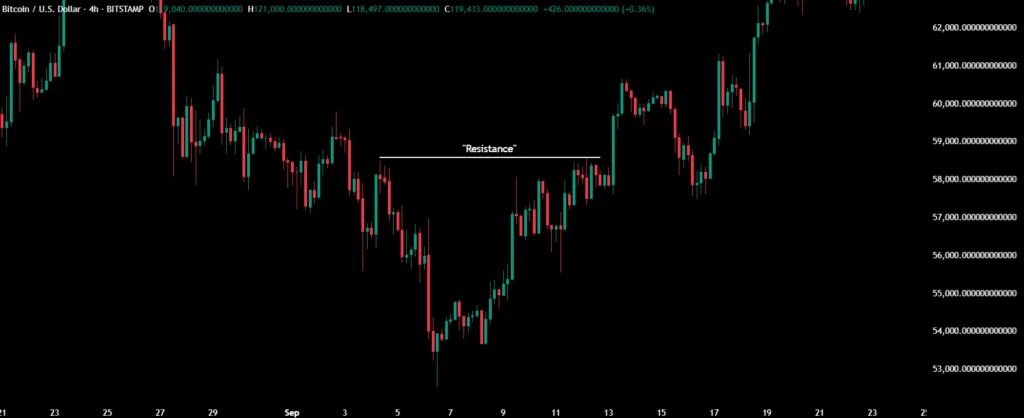
- Highs and lows of previous sessions? Gold.
- Weak highs/lows that haven’t been swept? Expect a stop hunt.
All of that is liquidity — places where orders are stacked. Smart money concept liquidity revolves around harvesting those areas before making a move.
💡How do smart money traders use liquidity zones? They wait for the traps, then take the other side. Long into red candles. Short into green FOMO.
So when I see a big candle down into a demand zone — and everyone panics — that’s when I smile. Because that’s exactly what they want. Retail panic = institutional opportunity.
💡Do liquidity zones show where big players are entering? Often, yes. Especially when followed by strong momentum and clean breaks of structure.
How to Draw Liquidity Zones and Avoid Fakeouts
If you’re wondering how to draw liquidity zones, start with the basics. Find sharp moves. Where did the price leave fast? Look left — did it grab liquidity before leaving? If so, you’re on the right track.
Also, don’t fall for every “zone” you see. Look for signs of price action liquidity traps — like false breakouts. These traps are engineered to sucker in breakout traders… and then reverse hard. Classic.
💡Can demand and supply zones help predict reversals? Yes — if they’re built on liquidity sweeps and structure alignment.
That’s why trading with liquidity zones beats just following indicators.
Most indicators (RSI, MACD) lag. And let’s be real — if the banks can see your indicator, why would they let it work? Sure, sometimes it seems like they respect it. But that’s just to lure in more orders for the next move. The real edge is understanding what the big players want.
Institutional Liquidity Zones: The Real Battlefield
When institutions move markets, they don’t want slippage. They want to offload large positions without crashing price. So what do they do?
They build longs during dips (accumulation) and sell into strength (distribution). To do this, they need institutional liquidity zones — areas where retail is eager to buy or sell. That’s where they strike.
Sometimes they even create bullish setups on lower timeframes… just to nuke it on the higher ones. That’s the game.
Forex Liquidity Zones Strategy: It Works Everywhere
Whether you’re on BTC, ETH or EUR/USD, the logic is the same. Forex liquidity zones strategy relies on structure and liquidity grabs — not crossing lines on indicators.
I look at structure first: is market structure bullish? Then any supply zone above is less likely to hold. Why? Because the narrative is to break the high, not reverse. Liquidity under previous lows? That’s a target.
💡Why are liquidity zones important for crypto or forex traders? Because that’s where price actually moves. Ignore liquidity and you’re trading blind.
Final Thoughts
Let’s keep it real — the market doesn’t owe us clarity. These are just scenarios, not certainties. But if you start seeing the charts through this lens — structure, liquidity, and manipulation — you’ll never unsee it.
And yeah, next time you see that big red candle into a demand zone, don’t freak out. That might just be the beginning of the move — not the end.
Frequently Asked Questions
1. What are demand and liquidity zones in trading?
They’re areas where big buyers (or sellers) entered the market — and where institutions hunt for counterparties.
2. How do you identify a demand zone on a chart?
Look for strong bullish moves preceded by liquidity grabs — especially imbalances and manipulative wicks.
3. What is the difference between a demand zone and a liquidity zone?
A demand zone is where buyers enter. A liquidity zone is where orders are stacked — often manipulated to trap retail.
4. Are liquidity zones visible on all timeframes?
Yes — and the best traders zoom in and out constantly to spot them.
5. Is it better to use demand zones or support/resistance levels?
Demand/supply zones are usually superior — they reflect intent, not just reaction.


